Published: 2026-03-25T16:32:10.000Z
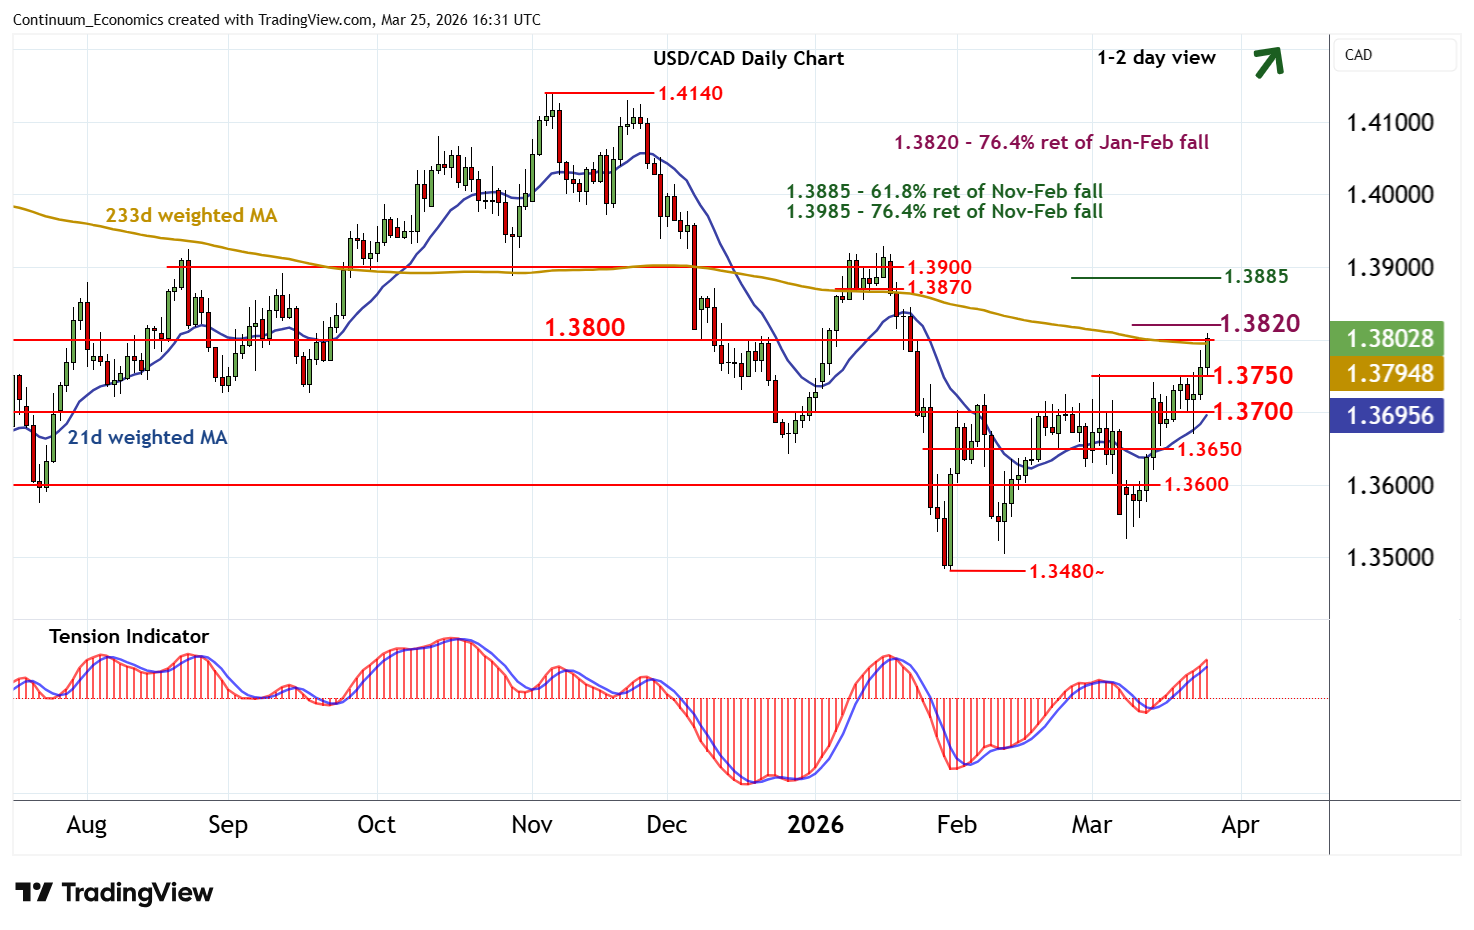
Chart USD/CAD Update: February gains pressuring resistance at 1.3800/20
4
Consolidation above 1.3750 has given way to a fresh break higher
| Levels | Imp | Comment | Levels | Imp | Comment | |||
|---|---|---|---|---|---|---|---|---|
| R4 | 1.3885 | ** | 61.8% ret of Nov-Feb fall | S1 | 1.3750 | * | break level | |
| R3 | 1.3870 | congestion lows | S2 | 1.3700 | * | congestion | ||
| R2 | 1.3820 | ** | 76.4% ret of Jan-Feb fall | S3 | 1.3650 | congestion | ||
| R1 | 1.3800 | * | congestion | S4 | 1.3600 | * | congestion |
Asterisk denotes strength of level
16:10 GMT - Consolidation above 1.3750 has given way to a fresh break higher, with prices currently pressuring congestion resistance at 1.3800. Just higher is the 1.3820 Fibonacci retracement, but already overbought intraday studies could limit any initial tests of this range, before rising daily readings and positive weekly charts prompt a break. A close above 1.3820 will improve sentiment and extend February gains towards resistance within the 1.3870 - 1.3800 range. Meanwhile, a close back below 1.3750, if seen, will help to stabilise price action and prompt fresh consolidation above congestion around 1.3700.