Published: 2026-05-06T11:42:44.000Z
Chart GBP/USD Update: Pushing higher
1
The anticipated break above 1.3600 has been seen
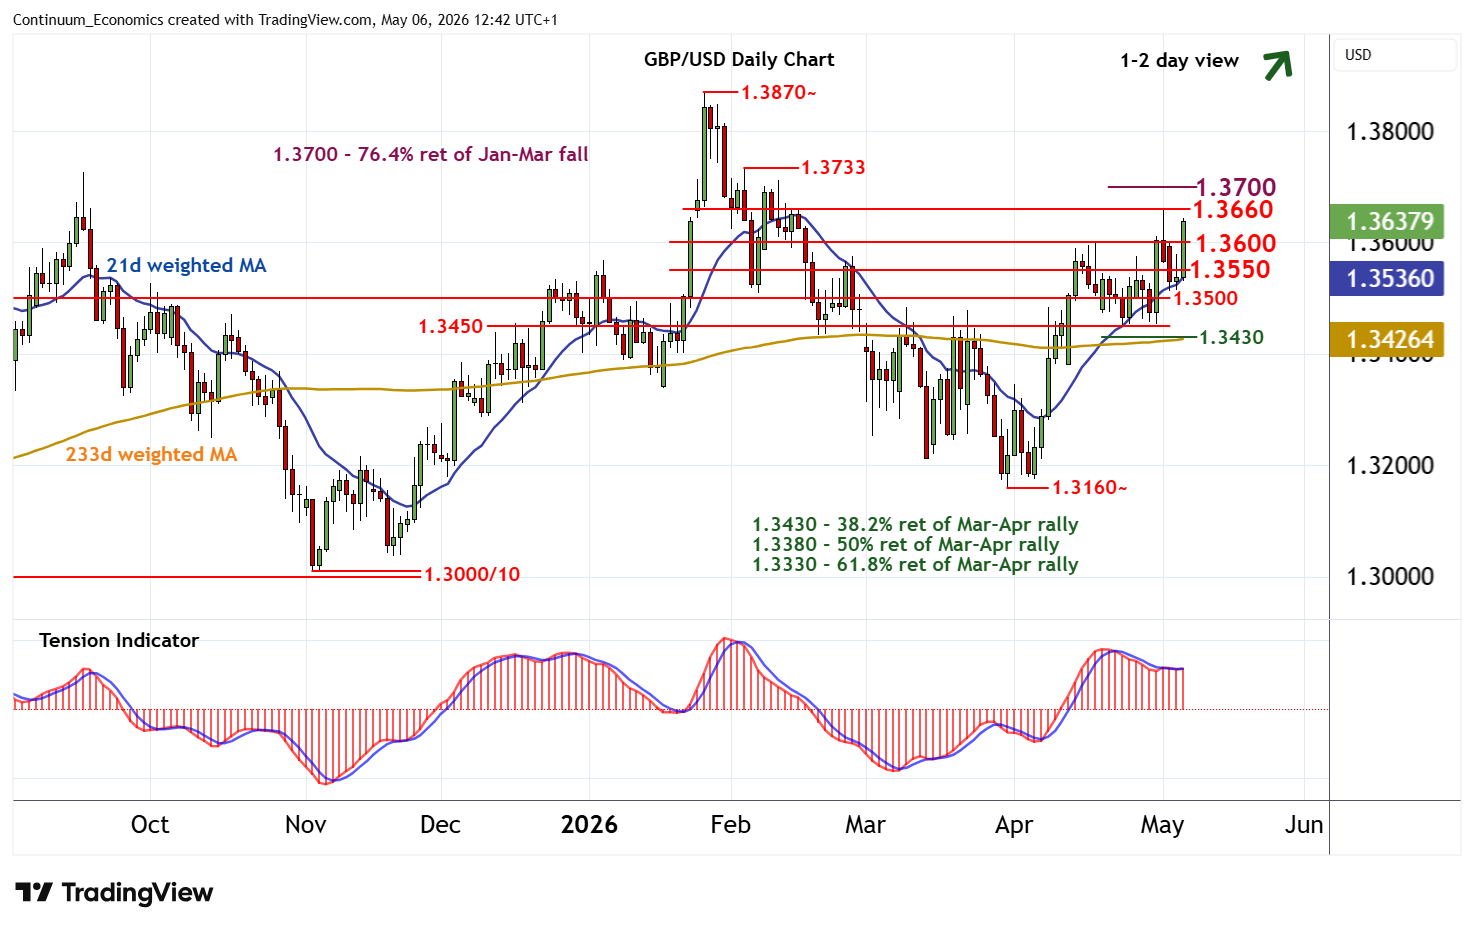
| Level | Comment | Level | Comment | |||||
|---|---|---|---|---|---|---|---|---|
| R4 | 1.3750 | * | congestion | S1 | 1.3600 | * | congestion | |
| R3 | 1.3733 | * | 4 Feb (m) high | S2 | 1.3550 | * | congestion | |
| R2 | 1.3700 | ** | 76.4% ret of Jan-Mar fall | S3 | 1.3500 | ** | congestion | |
| R1 | 1.3660 | * | congestion | S4 | 1.3450 | break level |
Asterisk denotes strength of level
12:35 BST - The anticipated break above 1.3600 has been seen, with prices approaching congestion resistance at 1.3660. Rising intraday studies are overbought, suggesting any immediate tests could give way to consolidation. However, daily readings have turned mixed/positive and broader weekly charts continue to improve, highlighting room for a later break and extension of late-March gains towards strong resistance at the 1.3700 Fibonacci retracement. Meanwhile, a close back below 1.3600 would stabilise price action and prompt fresh consolidation above further congestion around 1.3550.