Published: 2026-01-23T06:55:25.000Z
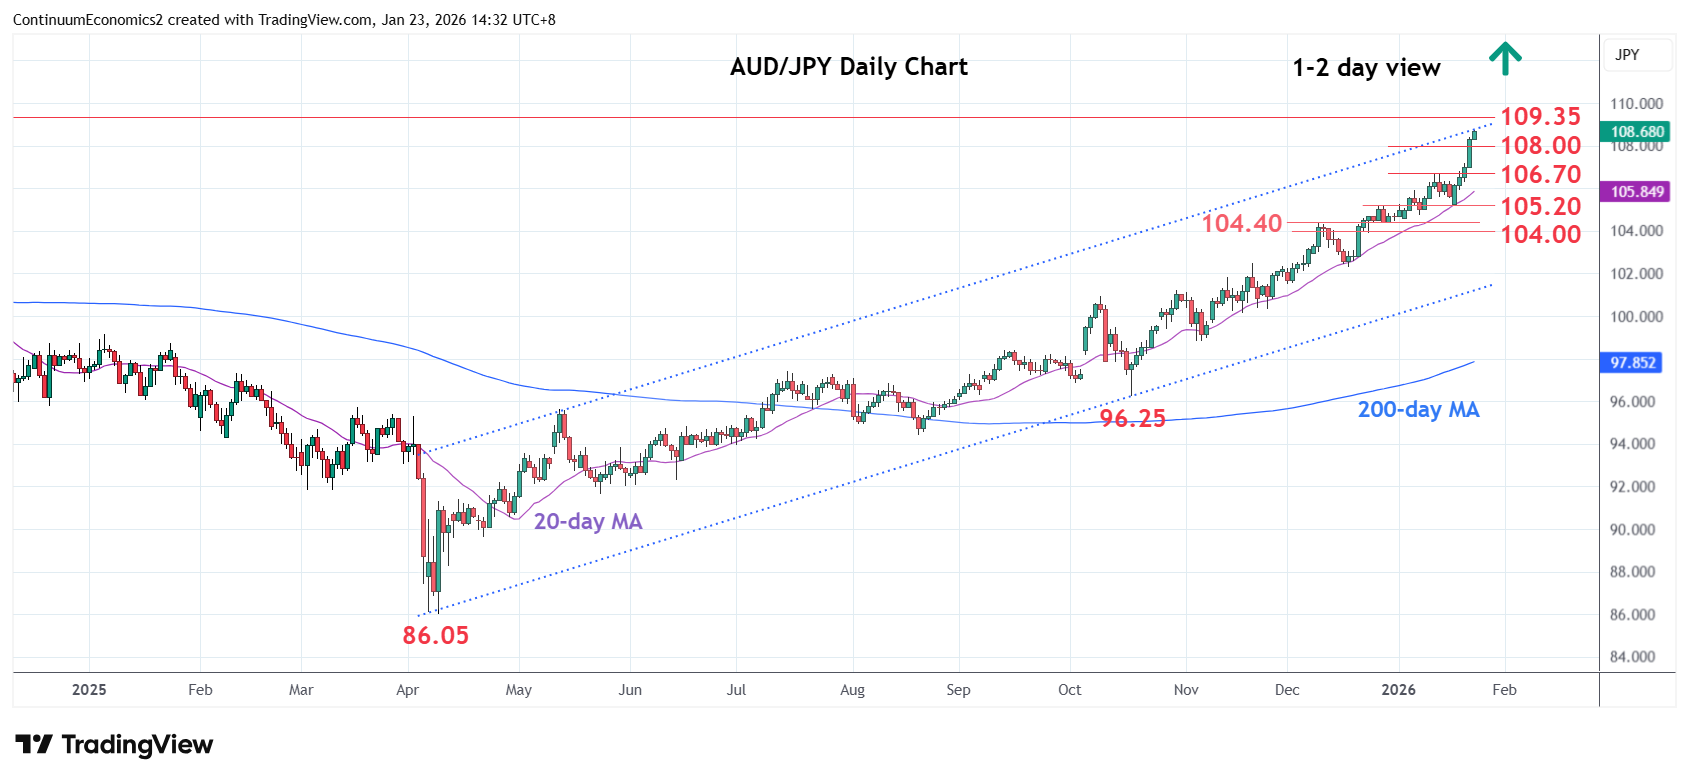
Chart AUD/JPY Update: Within reach of 109.35, 2024 year high
-
Extending gains to reach channel resistance from the April low at 108.70
| Levels | Imp | Comment | Levels | Imp | Comment | |||
|---|---|---|---|---|---|---|---|---|
| R4 | 110.00 | * | figure | S1 | 108.00 | * | congestion | |
| R3 | 109.70 | ** | Mar 1991 year high | S2 | 106.70 | * | 14 Jan high | |
| R2 | 109.35 | ** | Jul 2024 year high | S3 | 106.00 | * | congestion | |
| R1 | 108.70 | intraday high | S4 | 105.20/00 | ** | 29 Dec high, congestion |
Asterisk denotes strength of level
06:50 GMT - Extending gains to reach channel resistance from the April low at 108.70. Just above this will see room to retest the 109.35, July 2024 multi-year high. Reaction here can be expected as the daily and weekly studies pushed deep into overbought areas and suggest scope for corrective pullback. Meanwhile, support is raised to the 108.00 level. Below this will see room for deeper pullback to retrace strong gains from the 96.25, October low. Lower will open up room to support at 106.70/00 area then 105.20/104.40, December highs.