Published: 2026-02-25T00:35:56.000Z
Chart NZD/USD Update: Ranging above .5950 support
1
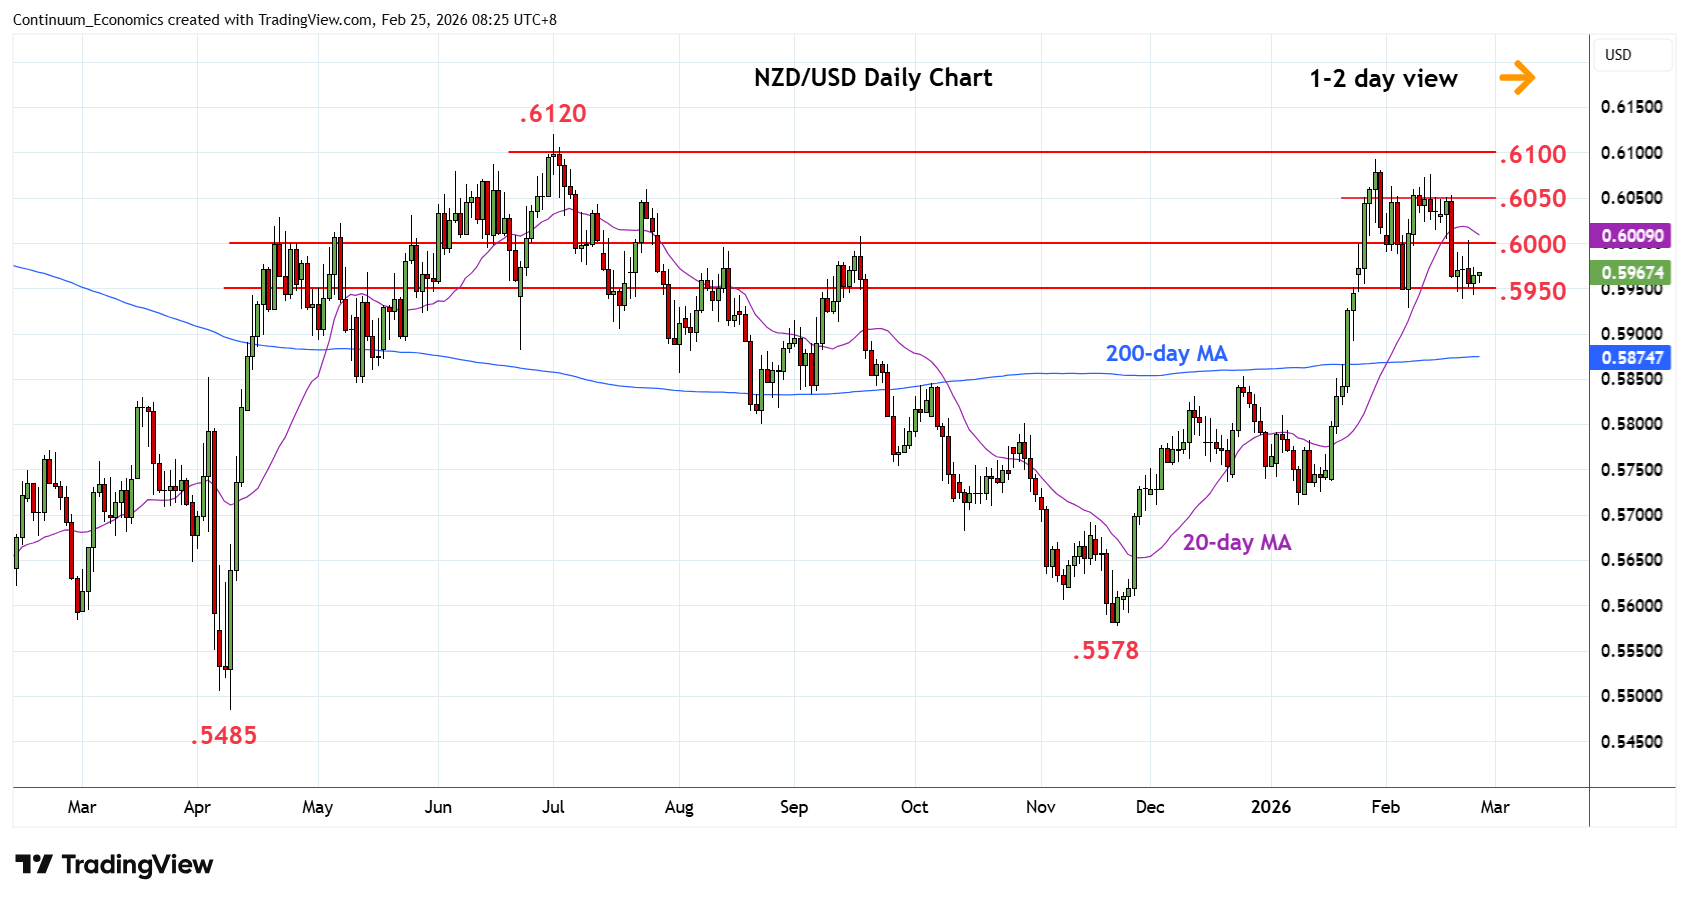
Limited break below the .5950 support keep prices is a sideway range following Monday's rejection from the .6000 level
| Levels | Imp | Comment | Levels | Imp | Comment | |||
|---|---|---|---|---|---|---|---|---|
| R4 | .6093 | ** | 29 Jan YTD high | S1 | .5950 | * | congestion | |
| R3 | .6076 | * | 12 Feb high | S2 | .5928 | ** | 6 Feb low | |
| R2 | .6050 | * | congestion | S3 | .5900 | * | 38.2% Nov/Jan rally | |
| R1 | .6000 | * | figure, congestion | S4 | .5853/50 | ** | Dec high, congestion |
Asterisk denotes strength of level
00:30 GMT - Limited break below the .5950 support keep prices is a sideway range following Monday's rejection from the .6000 level. Would take break of support at the .5950 and .5928 low of 6 February to open up room for deeper pullback to retrace the November/January rally and see scope to target .5900, 38.2% Fibonacci level. Lower still, will see room for extension to strong support at .5853 December high. Meanwhile, resistance remains at the .6000 level and this is expected to cap. Above here will fade the downside pressure and extend choppy price action within the .6050/.5950 area.