Published: 2026-01-14T06:05:39.000Z
Chart AUD/JPY Update: Extending gains
-
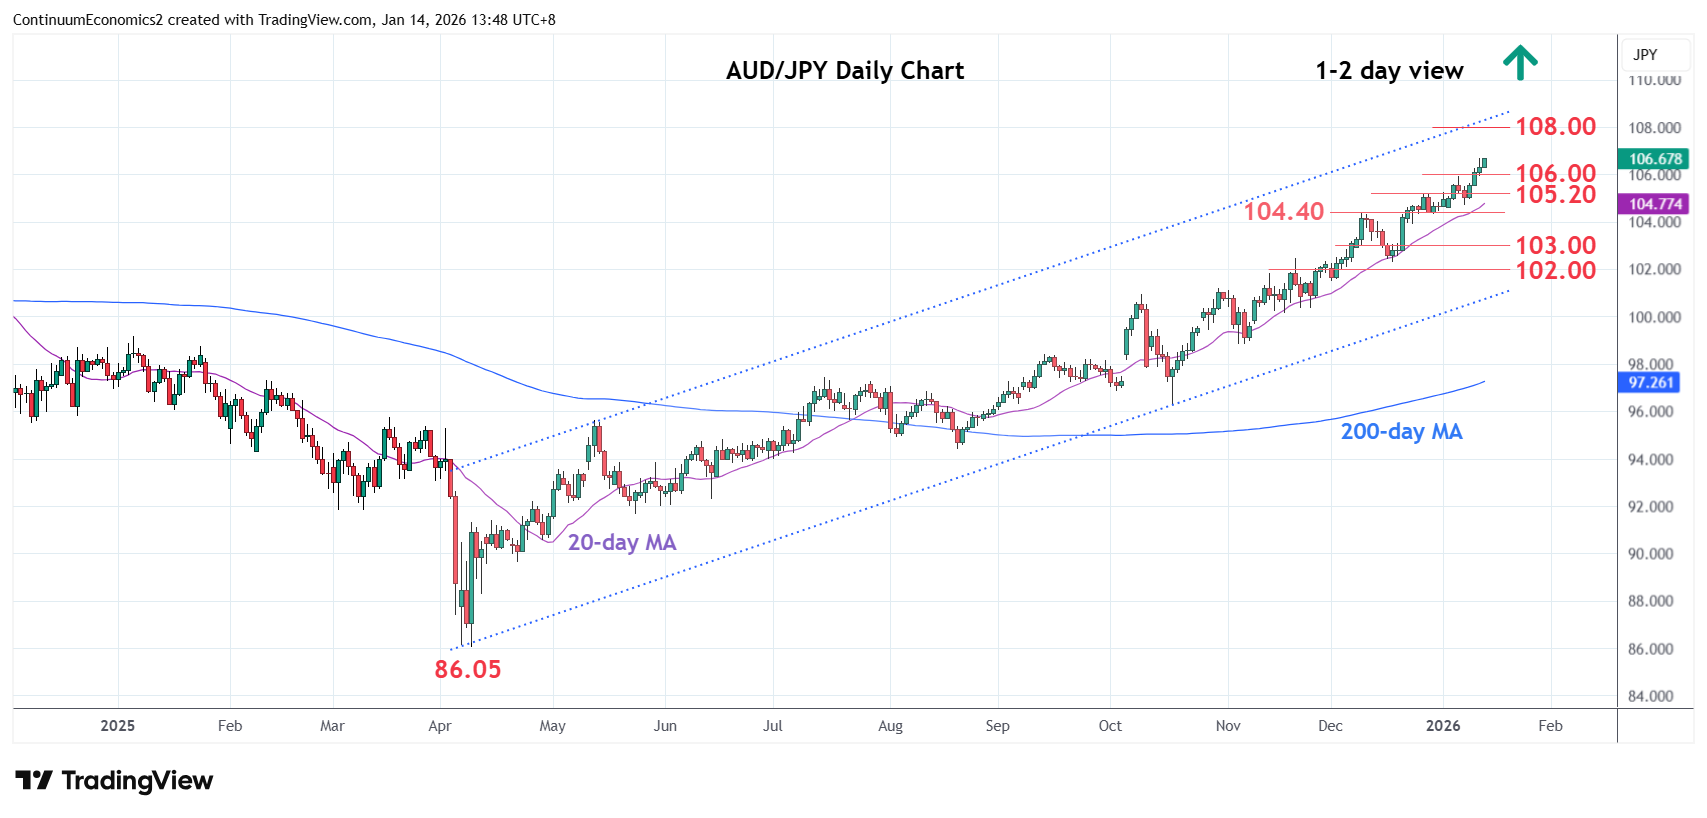
Break above the 106.00 level see prices extending bullish gains from the 86.05, April 2025 year low
| Levels | Imp | Comment | Levels | Imp | Comment | |||
|---|---|---|---|---|---|---|---|---|
| R4 | 110.00 | ** | figure | S1 | 106.00 | * | congestion | |
| R3 | 109.35 | ** | Jul 2024 year high | S2 | 105.20/00 | * | 29 Dec high, congestion | |
| R2 | 108.00 | * | congestion | S3 | 104.40 | ** | 9 Dec high | |
| R1 | 107.00 | * | congestion | S4 | 104.00 | * | congestion |
Asterisk denotes strength of level
06:00 GMT - Break above the 106.00 level see prices extending bullish gains from the 86.05, April 2025 year low. Higher will see room for continuation to the 107.00/108.00 congestion area. Deep overbought daily and weekly studies suggest reaction at the latter likely but a later break here cannot be ruled out. Higher still, will turn focus to the 109.35, July 2024 year high. Meanwhile, support is raised to the 106.00 level. Would take break here to delay bulls and see room for deeper pullback to strong support at the 105.20/104.40, December highs.