Chart USD/ZAR Update: Strong resistance at the 17.2750 Fibonacci retracement
Still little change, as prices extend cautious trade within resistance at 17.0000 - 17.1200
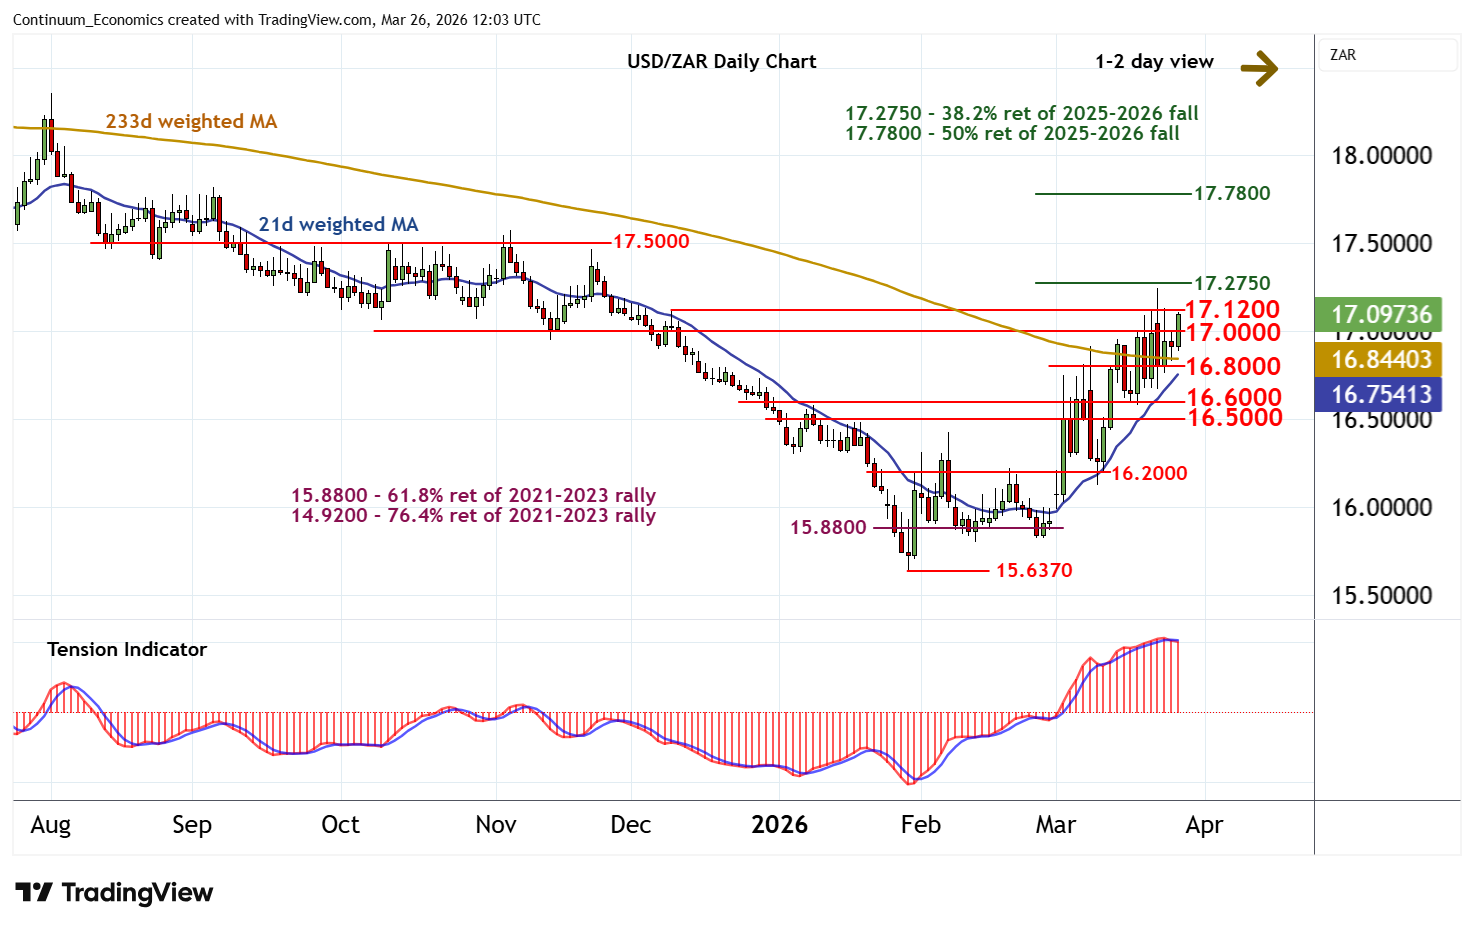
| Level | Comment | Level | Comment | |||||
|---|---|---|---|---|---|---|---|---|
| R4 | 17.5000 | ** | break level | S1 | 16.8000 | congestion | ||
| R3 | 17.2750 | ** | 38.2% ret of 2025-2026 fall | S2 | 16.6000 | break level | ||
| R2 | 17.1200 | * | 9 Dec (w) high | S3 | 16.5000 | break level | ||
| R1 | 17.0000 | * | congestion | S4 | 16.2000 | * | congestion |
Asterisk denotes strength of level
11:55 GMT - Still little change, as prices extend cautious trade within resistance at 17.0000 - 17.1200. Daily stochastics have ticked higher, highlighting room for a break and continuation of late-January gains towards resistance at the 17.2750 Fibonacci retracement. But the deteriorating daily Tension Indicator and flattening overbought weekly stochastics should limit any initial tests in consolidation, before improving longer-term charts prompt further gains. Meanwhile, support remains at congestion around 16.8000. A close beneath here, if seen, will open up the 16.5000 - 16.6000 range, where fresh consolidation is expected to develop.