Chart EUR/JPY Update: Further consolidation

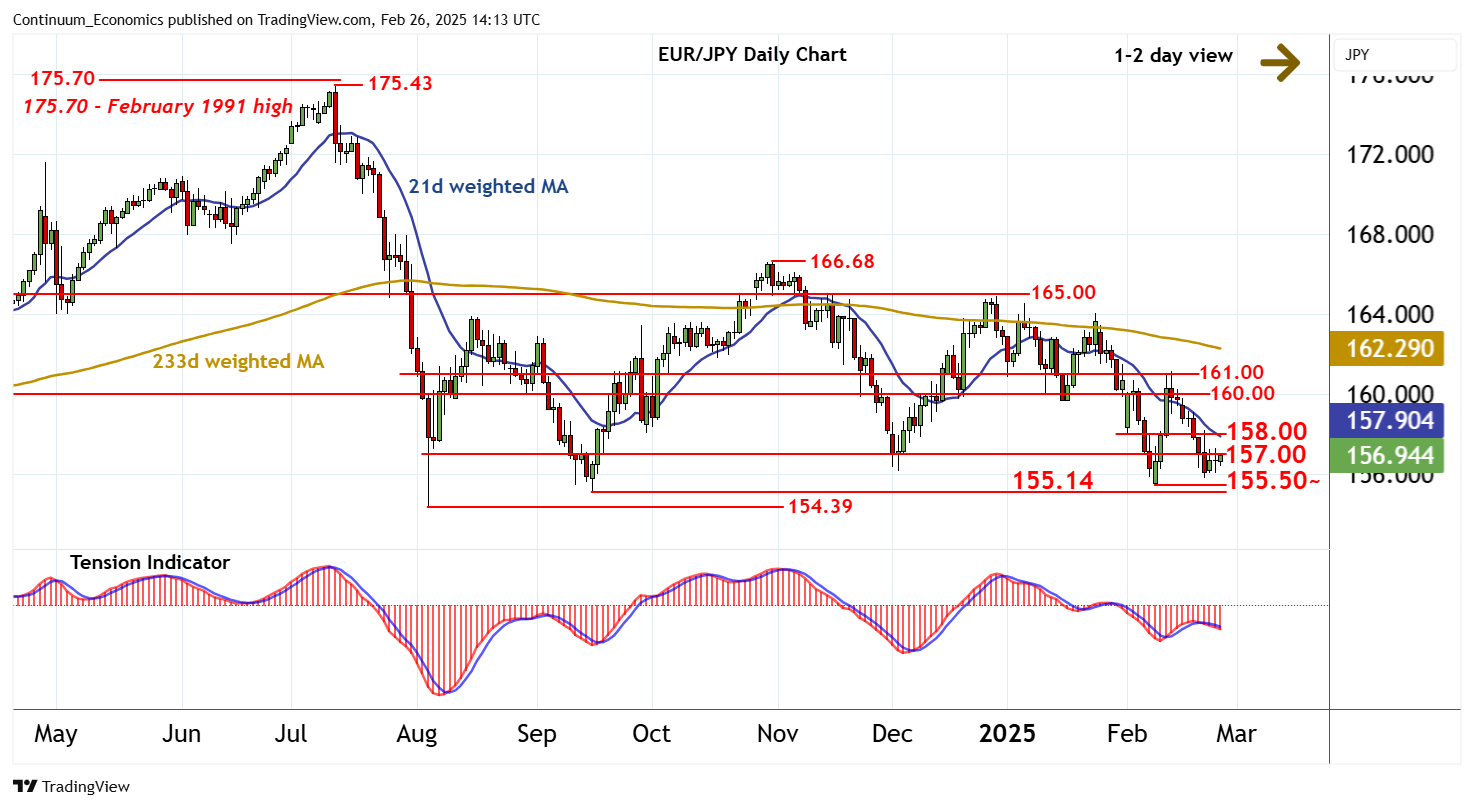
Still little change, as prices extend consolidation beneath congestion resistance at 157.00
| Levels | Imp | Comment | Levels | Imp | Comment | |||
|---|---|---|---|---|---|---|---|---|
| R4 | 161.00 | break level | S1 | 156.00 | minor congestion | |||
| R3 | 160.00 | * | congestion | S2 | 155.50 | * | 10 Feb YTD low | |
| R2 | 158.00 | * | break level | S3 | 155.14 | ** | 16 Sep (m) low | |
| R1 | 157.00 | * | congestion | S4 | 154.39 | ** | 5 Aug 2024 (y) low |
Asterisk denotes strength of level
14:00 GMT - Still little change, as prices extend consolidation beneath congestion resistance at 157.00. Intraday studies have ticked higher and bearish daily stochastics are flattening, suggesting room for a test above here. But the bearish daily Tension Indicator and mixed/negative weekly charts are expected to limit scope in renewed selling interest towards the 158.00 break level. Meanwhile, support remains down to the 155.50~ current year low of 10 February. But a tick higher in oversold weekly stochastics is expected to limit any immediate break in consolidation above the 155.14 monthly low of 16 September. Longer-term studies are mixed/negative, but a close below the 154.39 year low of 5 August is needed to confirm a more significant bear trend.