Published: 2025-12-10T12:33:37.000Z
Chart USD/ZAR Update: Cautious trade - background studies under pressure
3
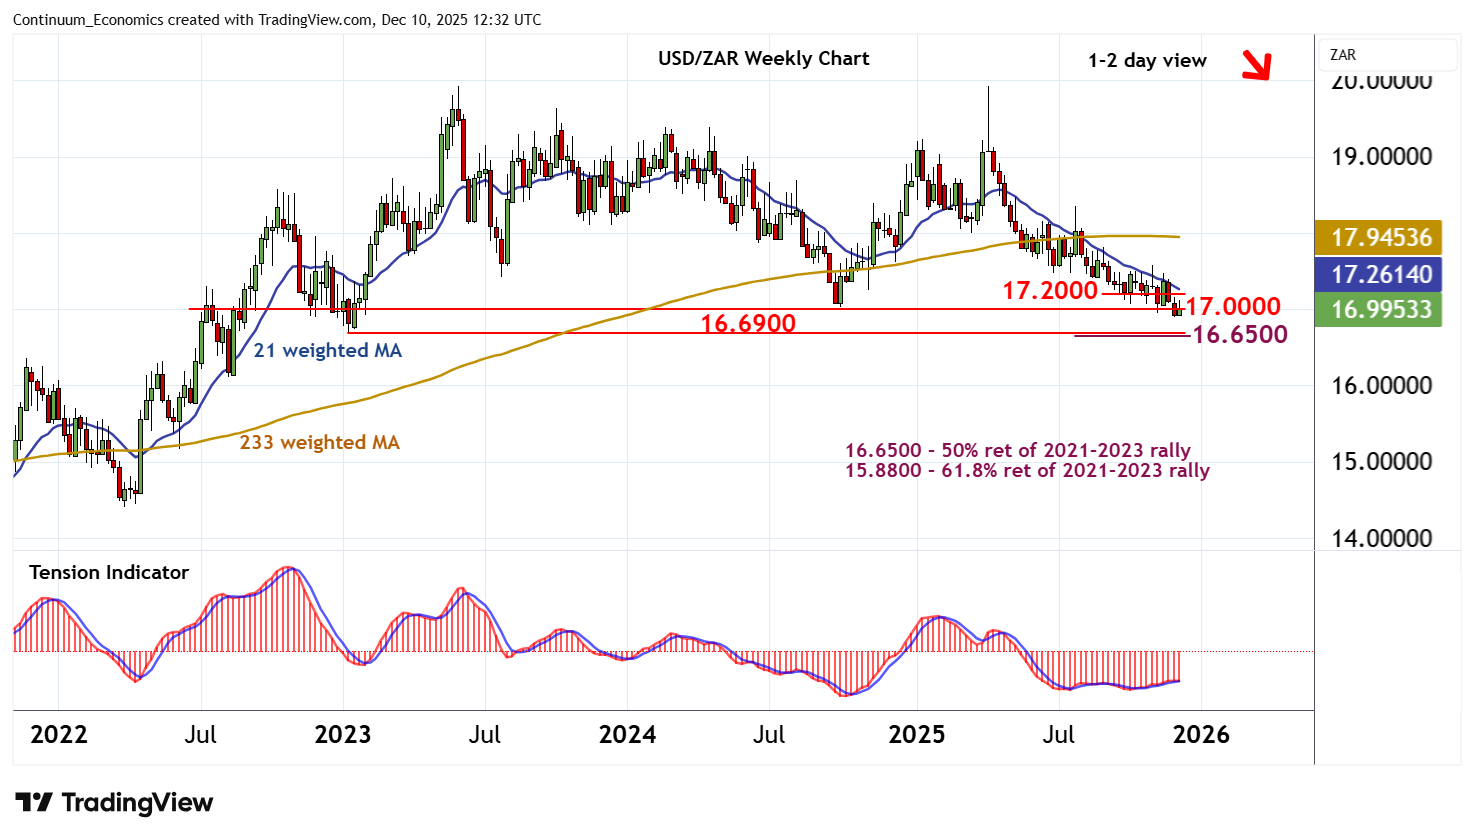
Little change, as unwinding oversold daily stochastics and the flat daily Tension Indicator extend cautious trade
| Level | Comment | Level | Comment | |||||
|---|---|---|---|---|---|---|---|---|
| R4 | 17.5775 | 5 Nov (w) high | S1 | 17.0000 | ** | congestion | ||
| R3 | 17.5000 | ** | congestion | S2 | 16.9000 | * | 5 Dec YTD low | |
| R2 | 17.4000 | * | congestion | S3 | 16.6900 | ** | January 2023 (y) low | |
| R1 | 17.2000 | * | congestion | S4 | 16.6500 | ** | 50% ret of 2021-2023 rally |
Asterisk denotes strength of level
12:10 GMT - Little change, as unwinding oversold daily stochastics and the flat daily Tension Indicator extend cautious trade above strong support at the 16.9000 current year low of 5 December and congestion around 17.0000. Following cautious trade, negative weekly and longer-term charts are expected to prompt fresh losses. A close below 16.9000-17.0000 will add weight to sentiment and extend April losses towards the 16.6900 year low of January 2023 and the 16.6500 Fibonacci retracement. Meanwhile, congestion resistance at 17.2000 should cap any immediate tests higher.