Published: 2025-12-16T00:21:29.000Z
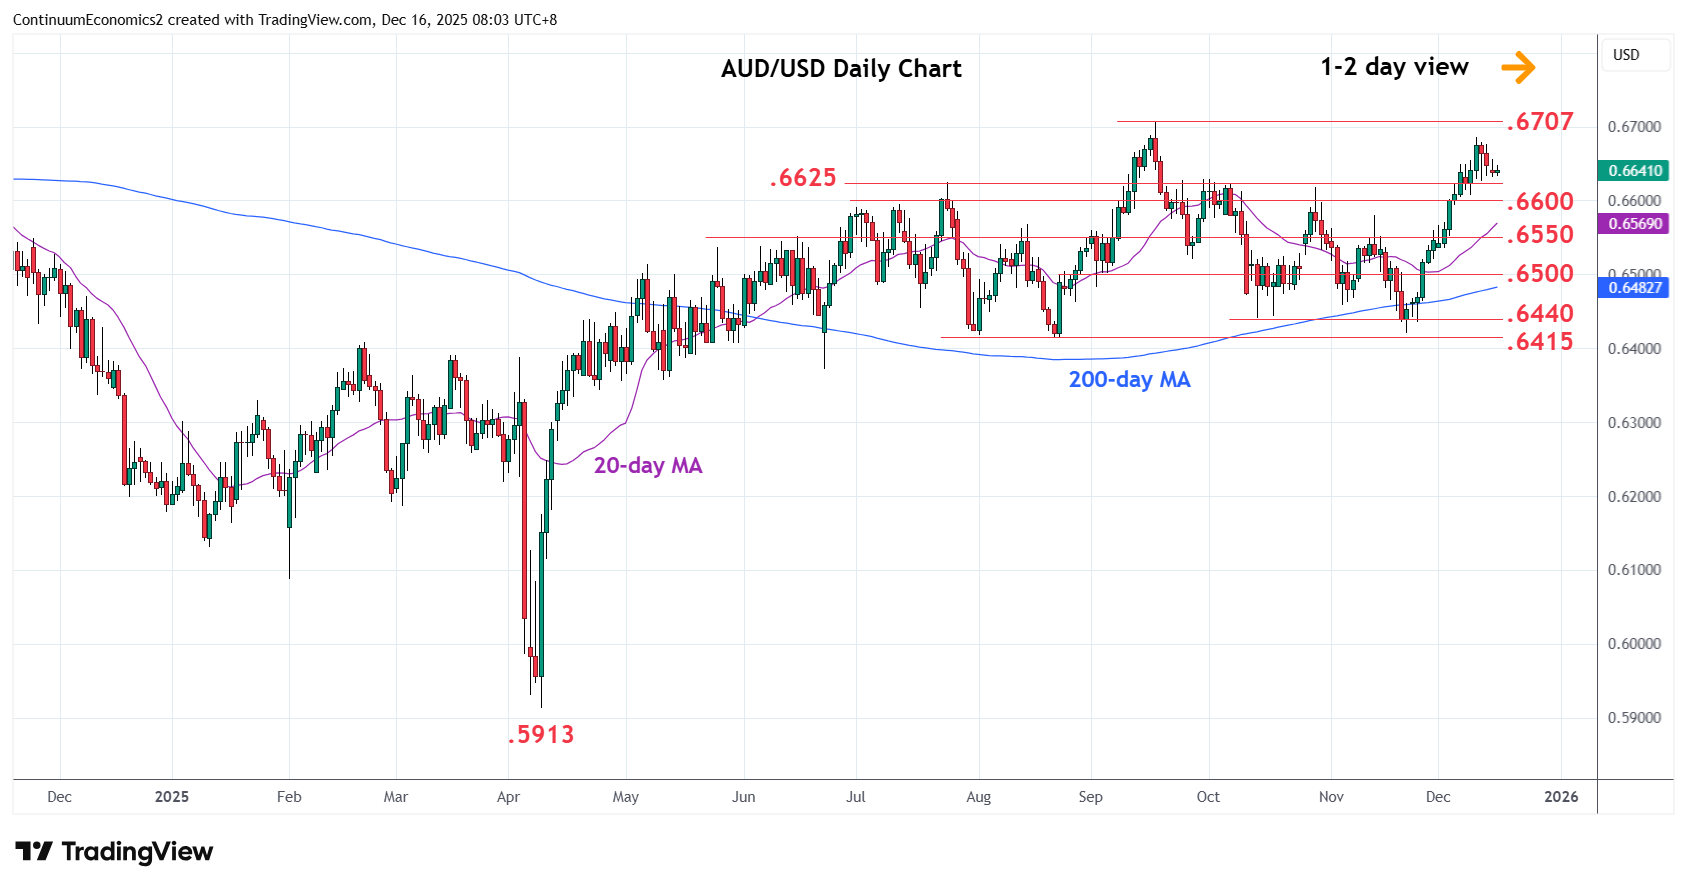
Chart AUD/USD Update: Extend consolidation below .6685 high
1
Little change, as prices stays range-bound below the .6685 high of last week
| Levels | Imp | Comment | Levels | Imp | Comment | |||
|---|---|---|---|---|---|---|---|---|
| R4 | 0.6750/00 | * | congestion | S1 | 0.6625/00 | * | Jul high, congestion | |
| R3 | 0.6710 | * | 38.2% 2021/Apr fall | S2 | 0.6550 | * | congestion | |
| R2 | 0.6700/07 | ** | figure, 17 Sep YTD high | S3 | 0.6500 | * | congestion | |
| R1 | 0.6685 | * | 10 Dec high | S4 | 0.6440/15 | ** | Oct, Aug lows |
Asterisk denotes strength of level
00:15 GMT - Little change, as prices stays range-bound below the .6685 high of last week. Overbought daily studies are unwinding and threatens pullback to support at the .6625/00 area. Break here will open up room for deeper correction of the rally from the .6421 November low to the .6550 support. Correction is expected to give way to renewed buying interest later and lift above .6685 high will turn focus to strong resistance the .6707/10, September YTD high and 38.2% Fibonacci level. Clearance here will extend the April gains and further retrace losses from the 2021 year high.