Published: 2025-11-21T01:47:52.000Z
Chart GBP/USD Update: Consolidating
1
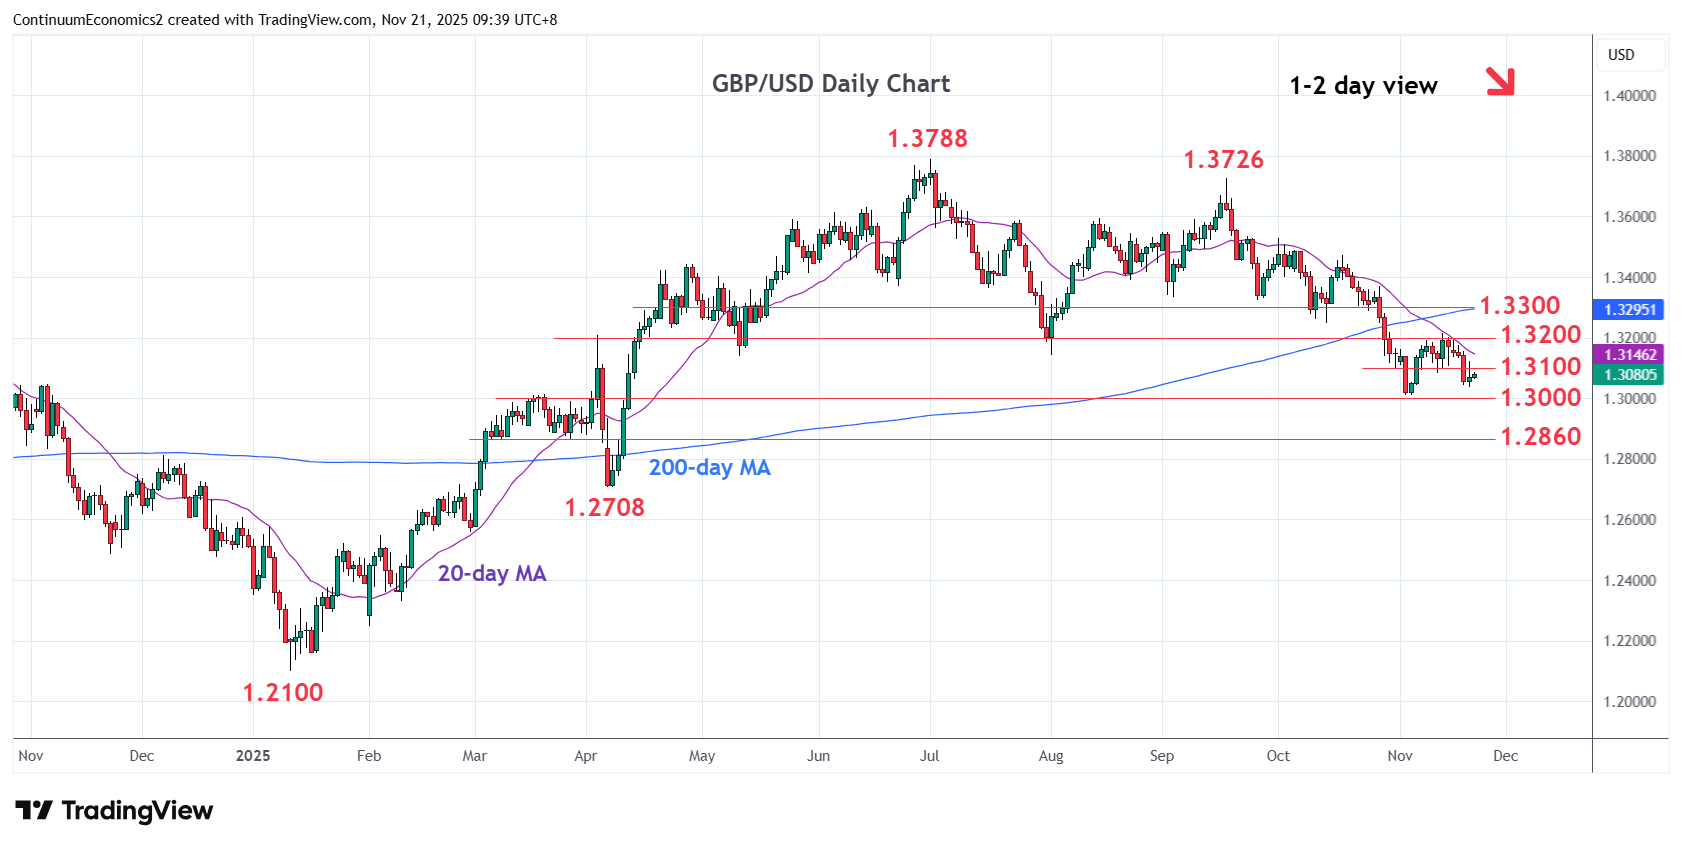
Steadied at the 1.3038 low as prices consolidate losses from the 1.3215 high and unwind oversold intraday studies
| Level | Comment | Level | Comment | |||||
|---|---|---|---|---|---|---|---|---|
| R4 | 1.3300 | * | congestion | S1 | 1.3010 | ** | 4 Nov low | |
| R3 | 1.3248 | * | 14 Oct low | S2 | 1.2945 | * | 50% Jan/Jul rally | |
| R2 | 1.3200/15 | ** | congestion, 13 Nov high | S3 | 1.2900 | * | congestion | |
| R1 | 1.3100 | * | congestion | S4 | 1.2860 | 10 Mar low |
Asterisk denotes strength of level
01:45 GMT - Steadied at the 1.3038 low as prices consolidate losses from the 1.3215 high and unwind oversold intraday studies. However, bearish structure from the 1.3726 September high keep pressure on the downside and see to retest the 1.3010 low. Break here, if seen, will open up room for further losses to retrace the January/July rally to 1.2945, 50% Fibonacci level. Meanwhile, resistance is lowered to the 1.3100 congestion which is expected to cap. Regaining this will ease the downside pressure and see room for bounce to retest the 1.3200/15 swing high.