Published: 2026-03-17T07:31:32.000Z
Chart EUR/AUD Update: Extend consolidation above 1.6130 low
1
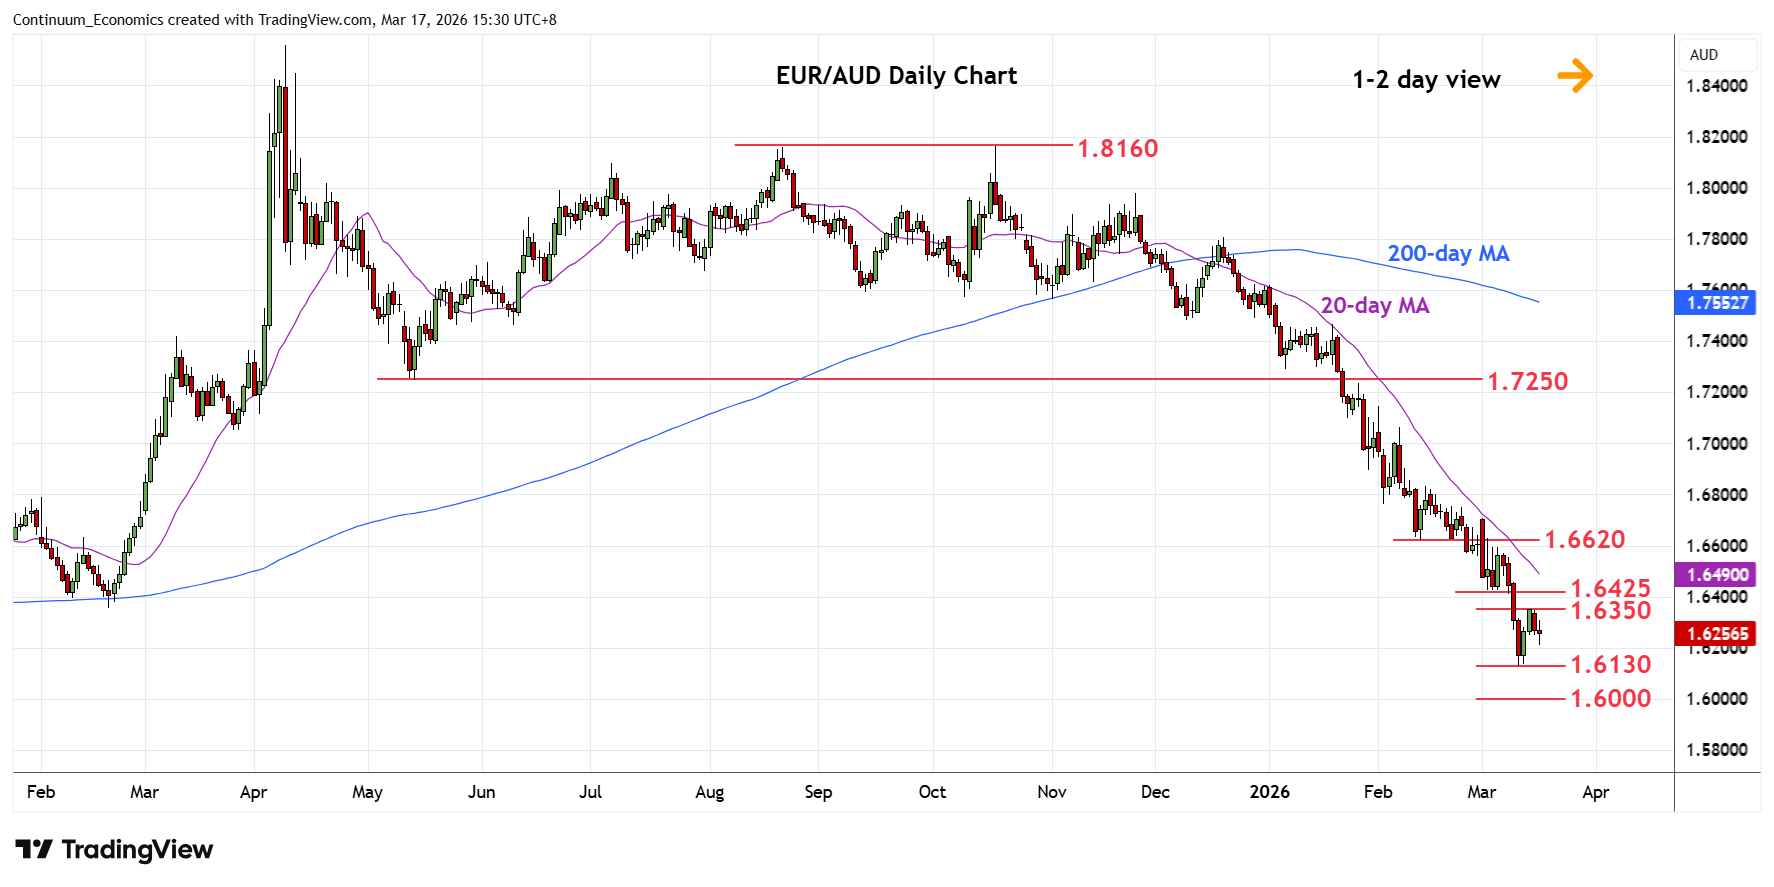
Corrective bounce from the 1.6130 low has met with selling pressure at the 1.6350 high
| Levels | Imp | Comment | Levels | Imp | Comment | |||
|---|---|---|---|---|---|---|---|---|
| R4 | 1.6600/20 | ** | congestion, 12 Feb low | S1 | 1.6200 | * | congestion | |
| R3 | 1.6500 | * | congestion | S2 | 1.6130 | ** | 11 Mar YTD low | |
| R2 | 1.6400/25 | * | congestion, 3 Mar low | S3 | 1.6100 | * | congestion | |
| R1 | 1.6350 | * | 13 Mar high | S4 | 1.6000 | ** | figure, congestion |
Asterisk denotes strength of level
07:20 GMT - Corrective bounce from the 1.6130 low has met with selling pressure at the 1.6350 high. Rejection there threatens retest of the 1.6200 level will and 1.6130 low and where break will extend the underlying bear trend from the October high to the 1.6100 level and strong support at 1.6000/1.5965, figure and 2024 year low. However, oversold daily and weekly studies caution stronger corrective bounce with lift over the 1.6350 resistance to open up room for stronger recovery to retrace losses from the October high to the 1.6400/25 area and 1.6500 congestion.