Published: 2026-03-03T02:15:25.000Z
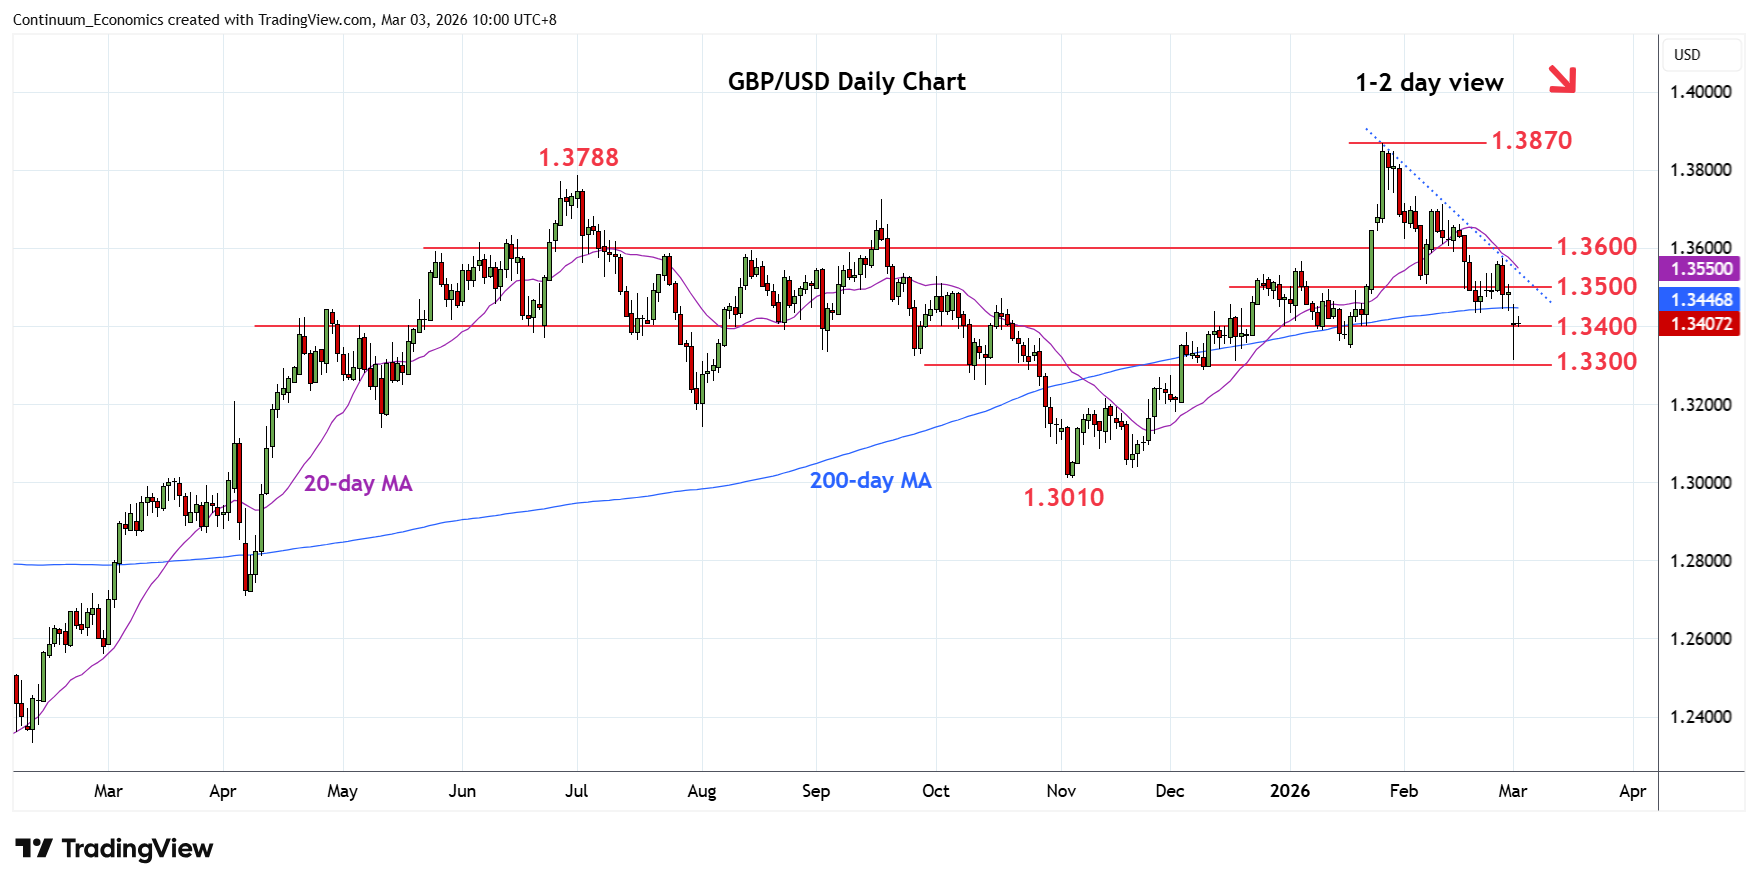
Chart GBP/USD Update: Consolidating spike to 1.3314 low
2
Break of the 1.3400 level saw follow-through below the 1.3340 January low to reach fresh year low at 1.3314
| Level | Comment | Level | Comment | |||||
|---|---|---|---|---|---|---|---|---|
| R4 | 1.3600 | * | congestion | S1 | 1.3400 | * | congestion | |
| R3 | 1.3575 | ** | 26 Feb high | S2 | 1.3340 | * | 19 Jan low | |
| R2 | 1.3500/10 | ** | congestion, 6 Feb low | S3 | 1.3300 | * | congestion | |
| R1 | 1.3450 | * | congestion | S4 | 1.3287 | 9 Dec low |
Asterisk denotes strength of level
02:10 GMT - Break of the 1.3400 level saw follow-through below the 1.3340 January low to reach fresh year low at 1.3314. Subsequent bounce see prices unwinding oversold intraday studies to consolidate above the 1.3400 level. However, negative daily and weekly studies keeps pressure on the downside and deeper pullback to retrace gains from the November low cannot be ruled out. Below the 1.3314 low and will see room to support at the 1.3300/1.3287 area. Meanwhile, resistance is lowered to the 1.3450 congestion and this extend to the strong resistance at 1.3500/10 area which is expected to cap.