Chart GBP/USD Update: Leaning lower
The break above congestion around 1.3700 has been pushed back from 1.3725
| Level | Comment | Level | Comment | |||||
|---|---|---|---|---|---|---|---|---|
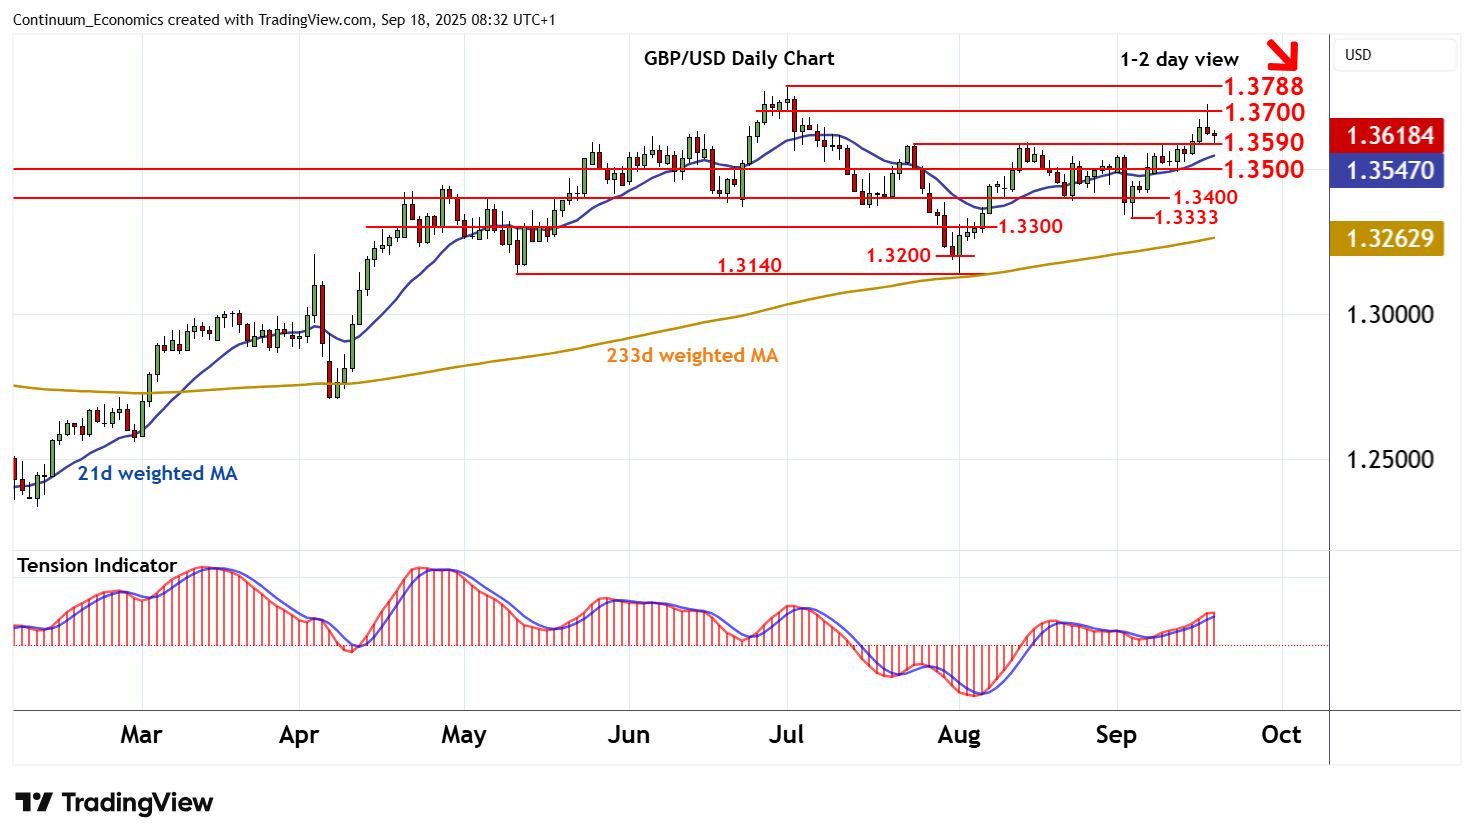
| R4 | 1.3800 | * | historic congestion | S1 | 1.3590/00 | ** | 24 Jul (w) high; cong | |
| R3 | 1.3788 | ** | 1 Jul YTD high | S2 | 1.3500 | ** | congestion | |
| R2 | 1.3725 | 17 Sep high | S3 | 1.3400 | * | congestion | ||
| R1 | 1.3700 | minor congestion | S4 | 1.3333 | * | 3 Sep low |
Asterisk denotes strength of level
08:10 BST - The break above congestion around 1.3700 has been pushed back from 1.3725, as intraday studies turn down, with sharp losses currently balanced above support at the 1.3590 weekly high of 24 July and congestion around 1.3600. Overbought daily stochastics are turning down and the positive daily Tension Indicator is flattening, suggesting room for a test beneath here. A break will open up congestion around 1.3500. But rising weekly charts are expected to limit any tests in renewed consolidation. Following corrective trade, fresh gains are looked for. A later break above the 1.3725 high of 17 September will improve price action and extend August gains towards critical resistance at the 1.3788 current year high of 1 July.