Published: 2025-02-07T04:07:29.000Z
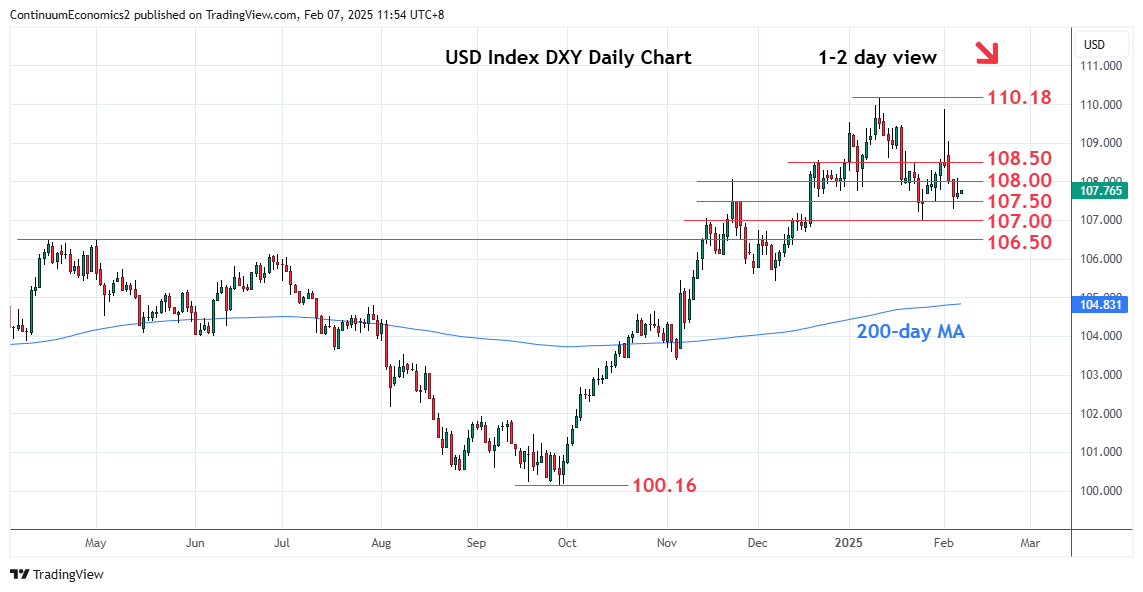
Chart USD Index DXY Update: Consolidating sharp losses from 109.88 spike high

Technical Analyst
1
Turned up from the 107.30 low as prices consolidate losses from the 109.88, Monday's spike high
| Levels | Imp | Comment | Levels | Imp | Comment | |||
|---|---|---|---|---|---|---|---|---|
| R4 | 109.50 | * | congestion | S1 | 107.30 | 5 Feb low | ||
| R3 | 109.00 | * | congestion | S2 | 107.00 | ** | Jan YTD low | |
| R2 | 108.50/60 | * | congestion, 15 Jan low | S3 | 106.50 | * | 2024 year high | |
| R1 | 108.00 | congestion | S4 | 106.35 | * | 38.2% Sep/Jan rally |
Asterisk denotes strength of level
04:00 GMT - Turned up from the 107.30 low as prices consolidate losses from the 109.88, Monday's spike high. The resulting flag pattern highlights risk for break lower to extend losses from the latter to retest the 107.00, current year low. Below here will extend the broader losses from the 110.18, January YTD high, to retrace rally from the September low. Lower will see room to the 106.50/35, support and 38.2% Fibonacci level. Meanwhile, resistance remains at 108.00 and extend to the 105.80/60 area which is expected to cap corrective bounce.