Chart EUR/GBP Update: Consolidating - studies leaning lower
Consolidation has given way to a test of resistance within the 0.8640 - 0.8650 range
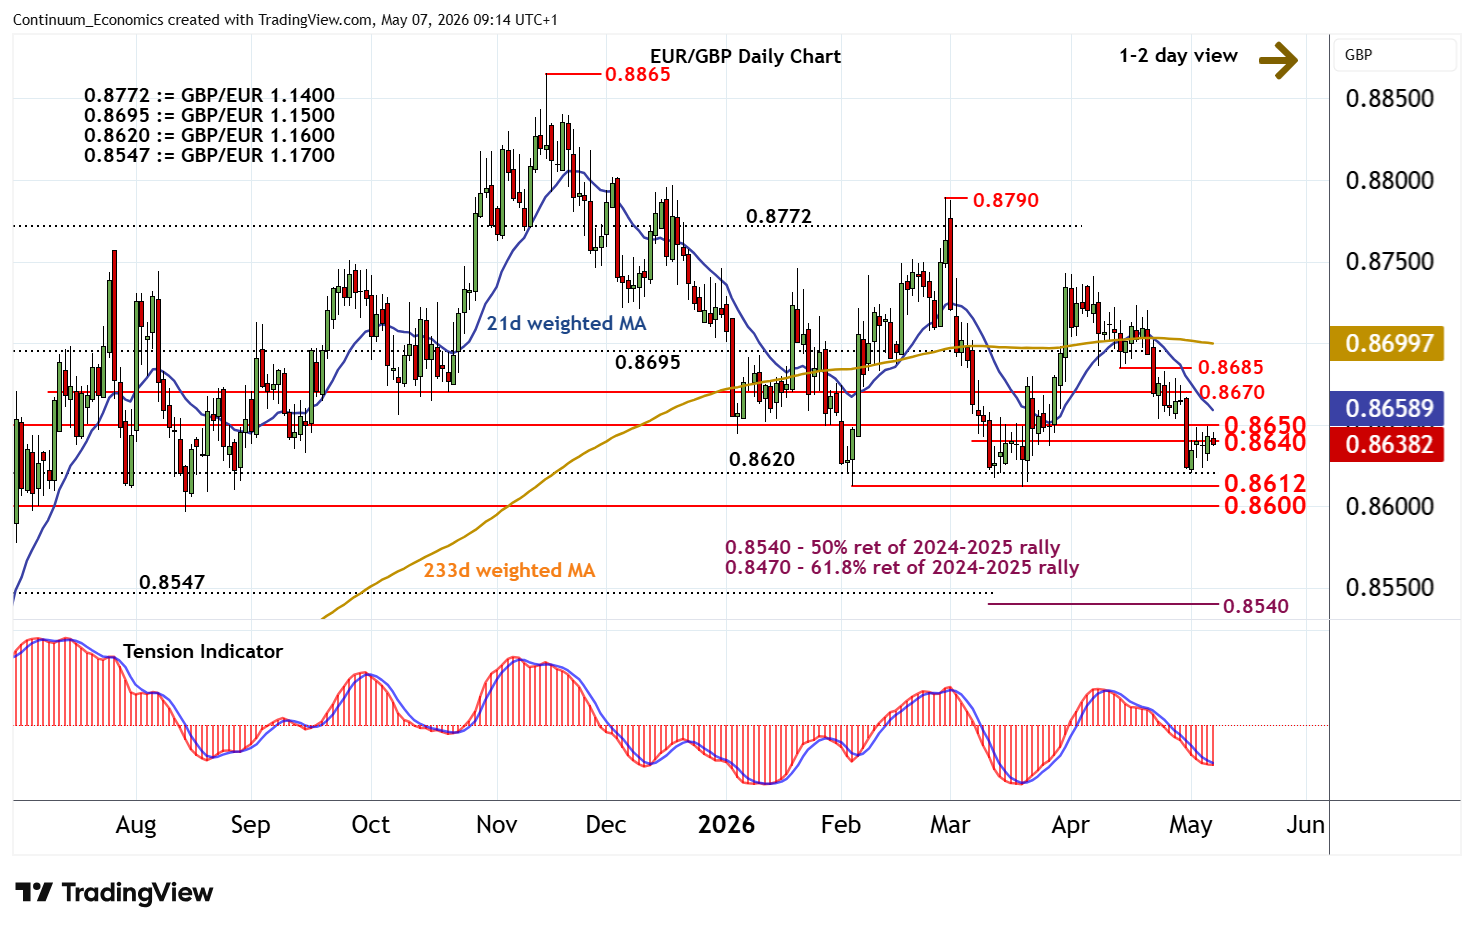
| Level | Comment | Level | Comment | |||||
|---|---|---|---|---|---|---|---|---|
| R4 | 0.8685 | * | 14 Apr (w) low | S1 | 0.8612/20 | ** | 19 Mar YTD low; GBP/EUR 1.1600 | |
| R3 | 0.8670 | * | congestion | S2 | 0.8600 | * | break level | |
| R2 | 0.8650 | * | congestion | S3 | 0.8547 | * | GBP/EUR 1.1700 | |
| R1 | 0.8640 | intraday lows | S4 | 0.8540 | ** | 50% ret of 2024-2025 rally |
Asterisk denotes strength of level
09:05 BST - Consolidation has given way to a test of resistance within the 0.8640 - 0.8650 range, where unwinding overbought intraday studies are prompting a pullback. Daily stochastics are rising and the bearish daily Tension Indicator is flattening, suggesting room for a retest of this range. But negative weekly charts should limit any break in renewed selling interest/consolidation beneath further congestion around 0.8670. Following cautious trade, fresh losses are looked for. Support is at the 0.8612 current year low of 19 March and 0.8620, (GBP/EUR 1.1600). A close beneath here will add weight to sentiment and extend November 2025 losses below 0.8600 towards strong support at the 0.8540 Fibonacci retracement and 0.8547, (GBP/EUR 1.1700).