Published: 2026-05-15T06:02:56.000Z
Chart AUD/USD Update: Sharp break of .7200 support
3
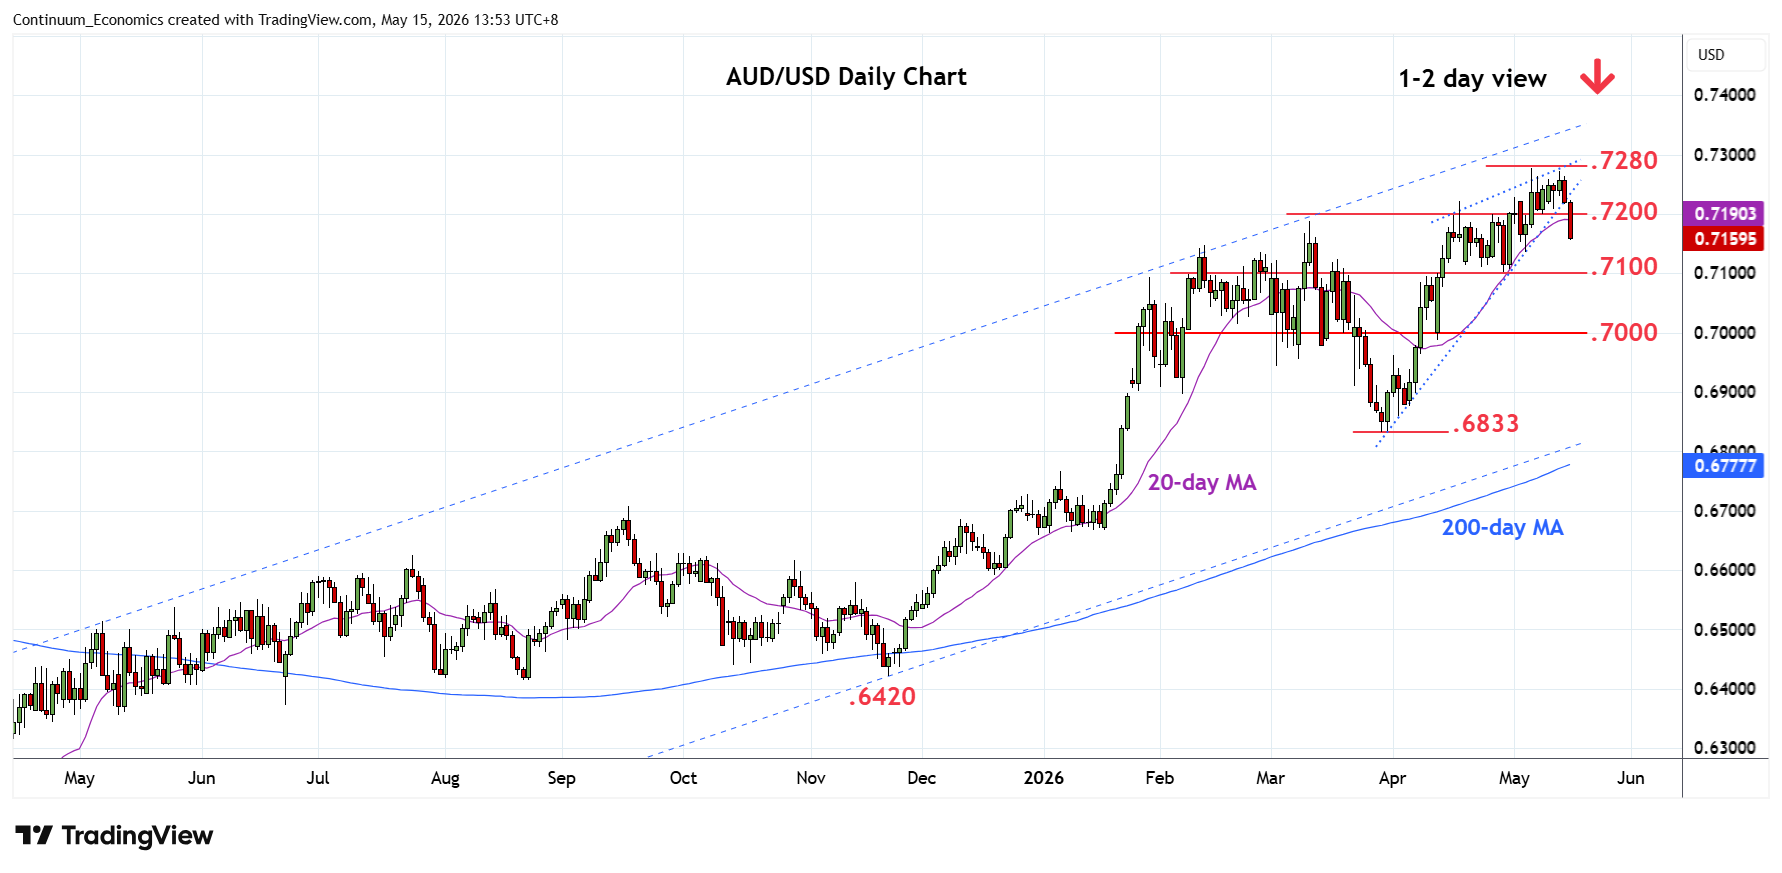
Consolidation below the .7278 current year high of 6 May has given way to break of a rising wedge and the .7200 support
| Levels | Imp | Comment | Levels | Imp | Comment | |||
|---|---|---|---|---|---|---|---|---|
| R4 | 0.7400 | ** | congestion | S1 | 0.7135 | * | 5 May low | |
| R3 | 0.7300 | * | congestion | S2 | 0.7100 | ** | congestion, 38.2% | |
| R2 | 0.7278/80 | ** | 6 May YTD high, congestion | S3 | 0.7055 | * | 50% Mar/May rally | |
| R1 | 0.7200 | * | congestion | S4 | 0.7000 | * | congestion, 61.8% |
Asterisk denotes strength of level
06:00 GMT - Consolidation below the .7278 current year high of 6 May has given way to break of a rising wedge and the .7200 support as daily studies unwind overbought readings. Pullback opens up room to strong support at .7135/.7100 congestion and 38.2% Fibonacci retracement. Below this will see scope for deeper pullback to .7055/.7100 Fibonacci levels. Meanwhile, resistance is lowered to the .7200 level which is expected to cap corrective bounce. Clearance will return focus to the upside for retest of .7278/80 current year high and see room to extend gains from April 2025 year low.