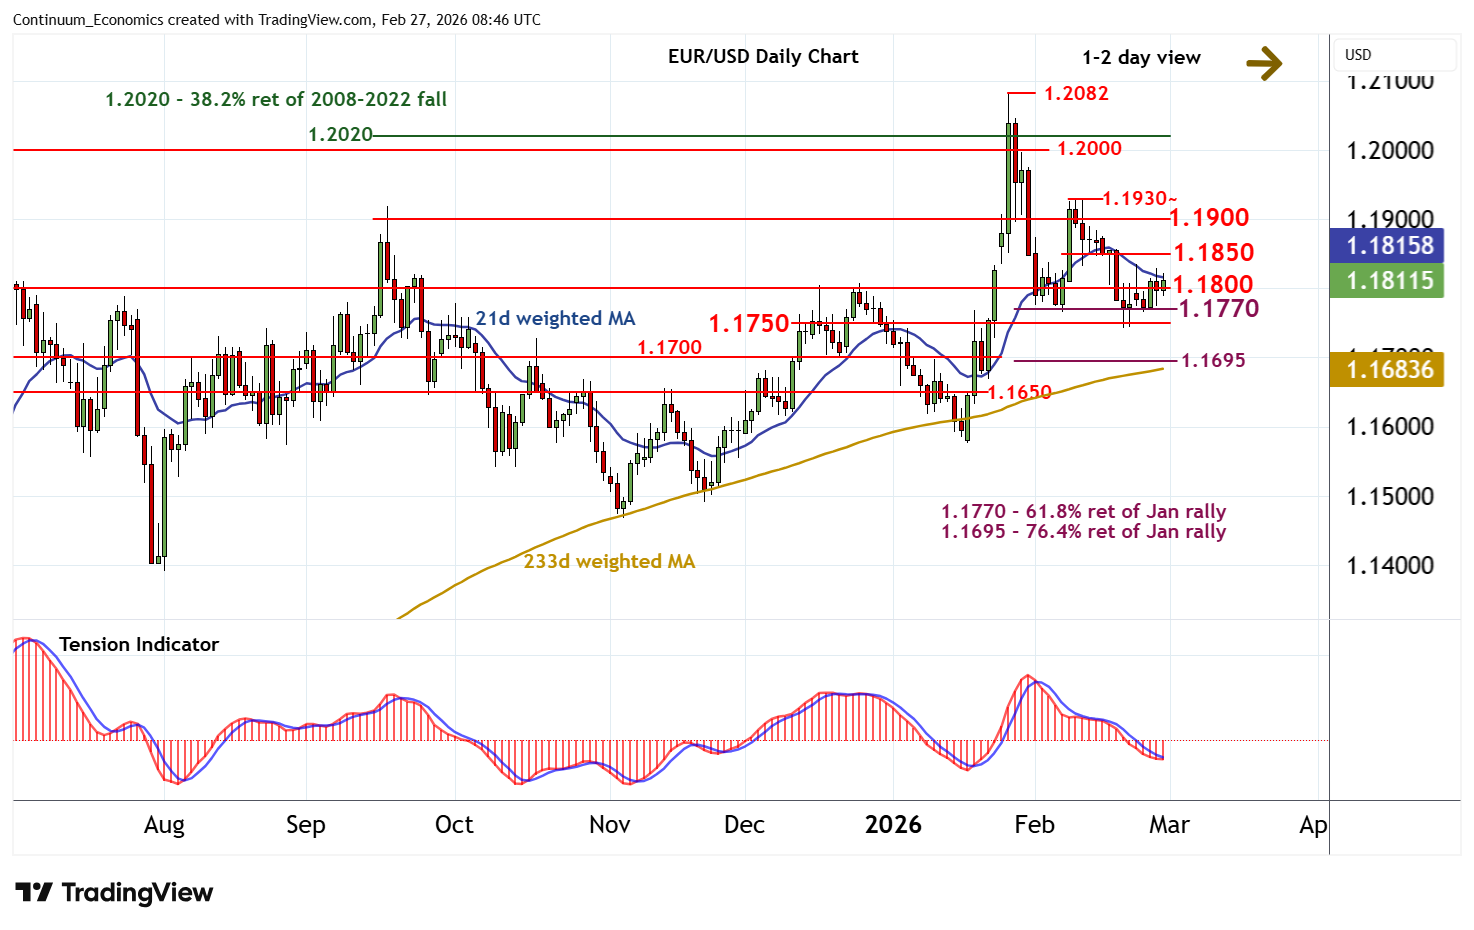
Chart EUR/USD Update: Limited gains from 1.1770/00
The anticipated break below 1.1800 has bounced from the 1.1770 Fibonacci retracement
| Levels | Imp | Comment | Levels | Imp | Comment | |||
|---|---|---|---|---|---|---|---|---|
| R4 | 1.2000 | ** | congestion | S1 | 1.1800 | * | congestion | |
| R3 | 1.1930~ | ** | 9-11 Feb (w) high | S2 | 1.1770 | ** | 61.8% ret of January rally | |
| R2 | 1.1900 | * | congestion | S3 | 1.1750 | ** | congestion | |
| R1 | 1.1850 | * | break level | S4 | 1.1695/00 | ** | 76.4% ret; congestion |
*Asterisk denotes strength of level
08:40 GMT - The anticipated break below 1.1800 has bounced from the 1.1770 Fibonacci retracement, as intraday studies turn mixed, with prices currently balanced back above 1.1800. Oversold daily stochastics are unwinding and the bearish daily Tension Indicator is flattening, suggesting potential for a test higher. But negative weekly charts should limit scope in renewed selling interest towards 1.1850. Following cautious/corrective trade, fresh losses are looked for. However, a close below congestion support at 1.1750 is needed to turn sentiment negative and confirm continuation of January losses, as focus then turns to strong support at the 1.1695 retracement and congestion around 1.1700. Oversold daily stochastics could limit any initial tests in short-covering/consolidation.