Published: 2026-02-27T00:48:42.000Z
Chart AUD/USD Update: Consolidating below .7147, current year high
1
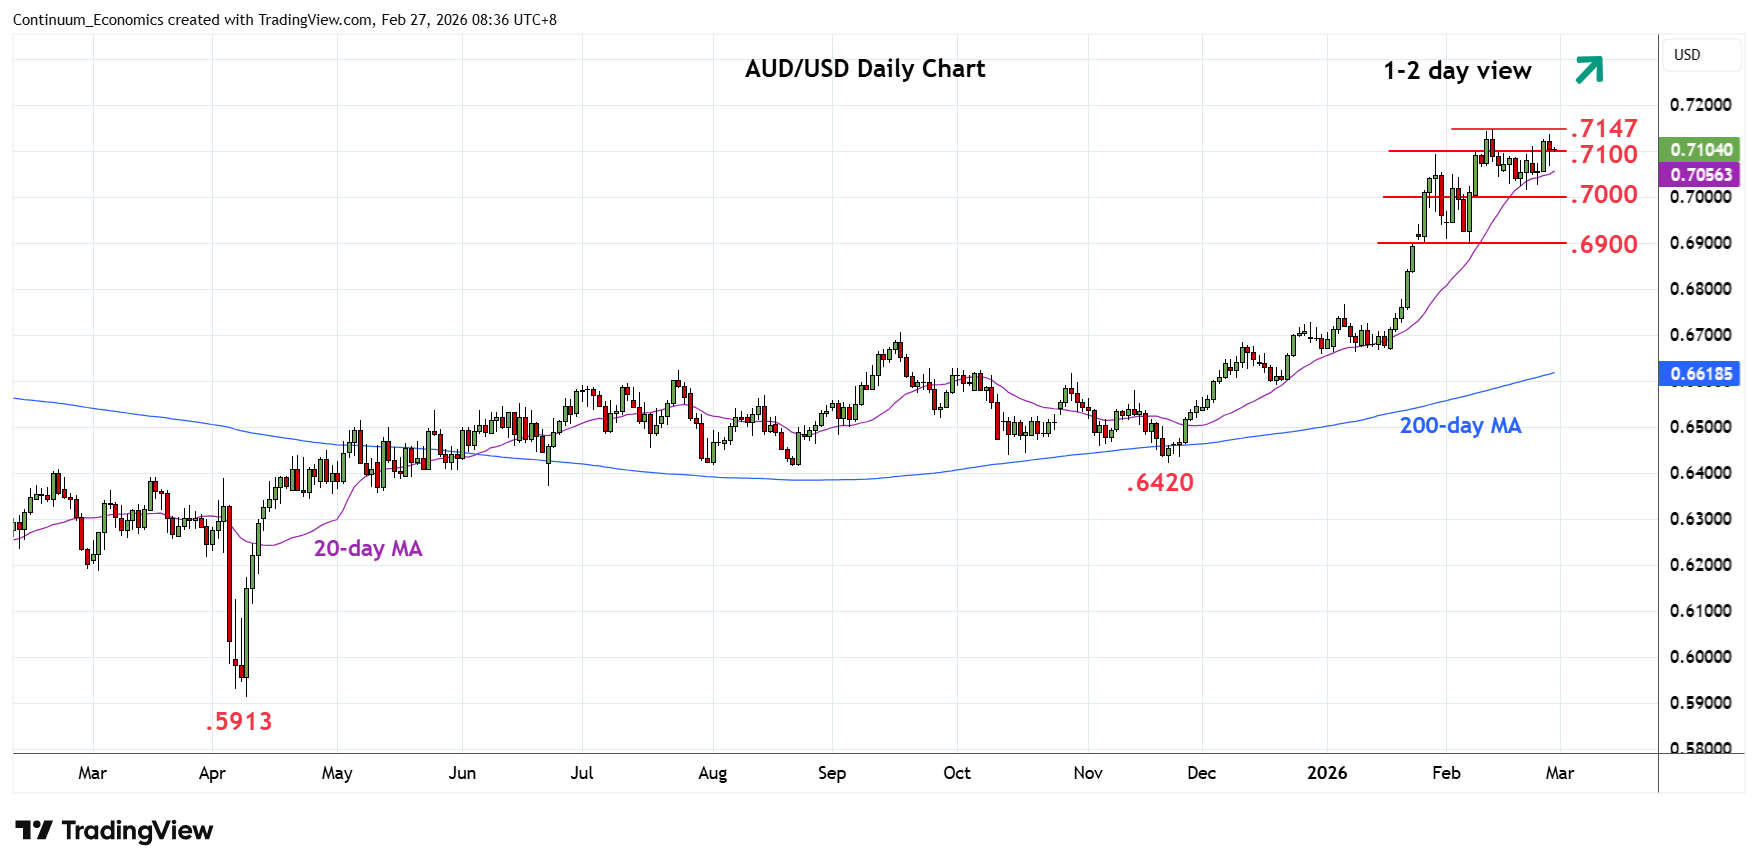
Break above the .7100 level has seen gains stalling ahead of the .7147 current year high
| Levels | Imp | Comment | Levels | Imp | Comment | |||
|---|---|---|---|---|---|---|---|---|
| R4 | 0.7280 | * | Jun 2022 high | S1 | 0.7100 | * | congestion | |
| R3 | 0.7250 | * | congestion | S2 | 0.7050/15 | ** | congestion, 20 Feb low | |
| R2 | 0.7205 | * | 61.8% 2021/2025 fall | S3 | 0.6900 | ** | congestion, 6 Feb low | |
| R1 | 0.7147 | ** | 12 Feb YTD high | S4 | 0.6870 | * | 38.2% Nov/Feb rally |
Asterisk denotes strength of level
00:40 GMT - Break above the .7100 level has seen gains stalling ahead of the .7147 current year high. Mixed daily studies suggest consolidation likely to extend beneath here but a later break cannot be ruled out. Clearance will see room to extend the underlying bull trend and see scope for extension to target .7205, 61.8% Fibonacci retracement. Higher still, will open up room to .7280, June 2022 high. Meanwhile, support is at the .7100/.7050 congestion area which should underpin. Would take break of these and the .7015 low to fade the upside pressure and open up room for deeper pullback.