Published: 2025-10-22T11:33:45.000Z
Chart USD/ZAR Update: Higher in range - studies improving
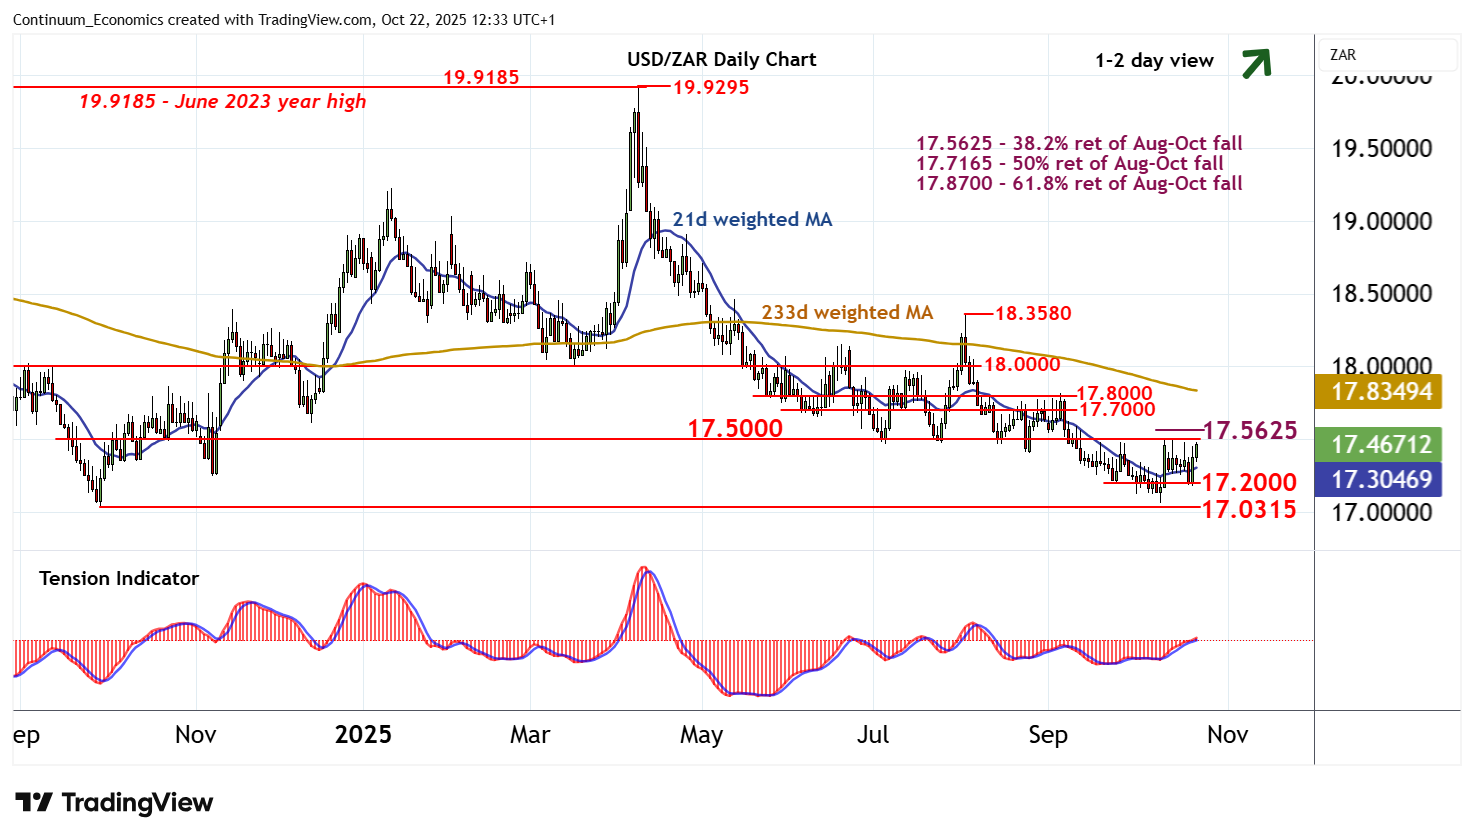
1
The bounce following the test of congestion support at 17.2000 is extending
| Level | Comment | Level | Comment | |||||
|---|---|---|---|---|---|---|---|---|
| R4 | 17.7165 | ** | 50% ret of Aug-Oct fall | S1 | 17.2000 | * | congestion | |
| R3 | 17.7000 | * | congestion | S2 | 17.0630 | * | 9 Oct YTD low | |
| R2 | 17.5625 | * | 38.2% ret of Aug-Oct fall | S3 | 17.0315 | ** | 30 Sep 2024 (y) low | |
| R1 | 17.5000 | ** | congestion | S4 | 17.0000 | ** | congestion |
Asterisk denotes strength of level
12:20 BST - The bounce following the test of congestion support at 17.2000 is extending, with prices currently balanced just below congestion resistance at 17.5000. Daily stochastics and the daily Tension Indicator have turned higher, highlighting room for further strength in the coming sessions. A break above here will improve sentiment and extend October gains towards the 17.5625 Fibonacci retracement. Rising weekly charts point to room for continuation towards congestion around 17.7000. Meanwhile, support remains at congestion around 17.2000, and should underpin any immediate setbacks.