Published: 2026-03-04T00:30:19.000Z
Chart AUD/USD Update: Leaning lower in volatile trade
2
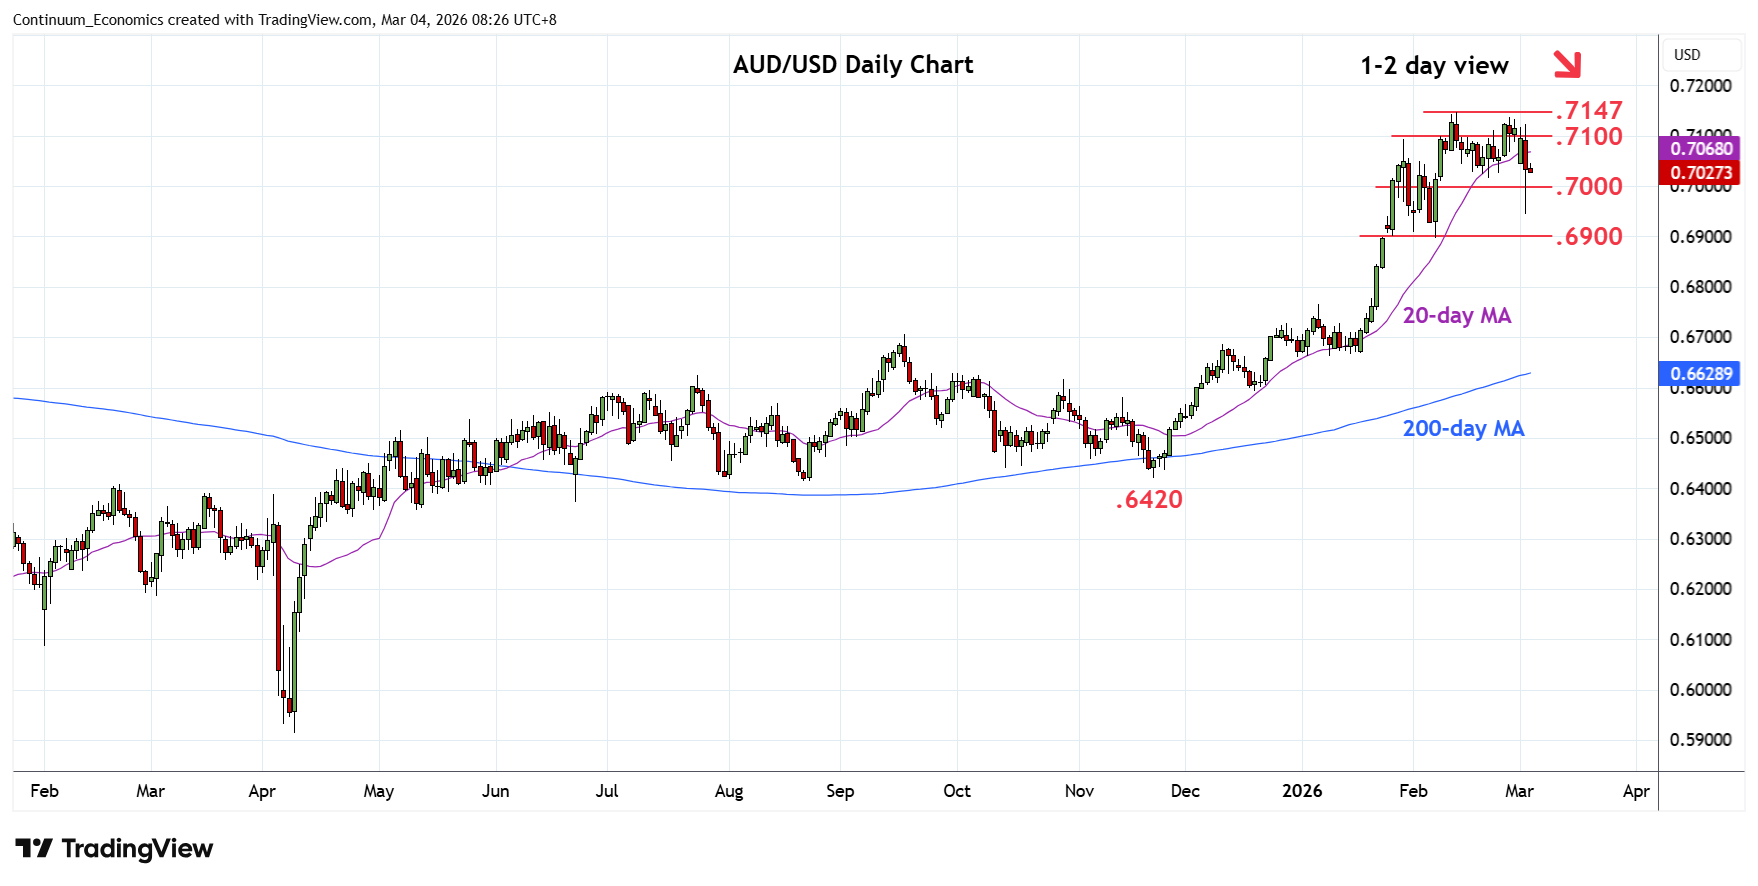
Volatile trade saw losses through the .7015/00 support before staging rebound to leave a long wick at the .6950 support
| Levels | Imp | Comment | Levels | Imp | Comment | |||
|---|---|---|---|---|---|---|---|---|
| R4 | 0.7280 | * | Jun 2022 high | S1 | 0.7015/00 | * | 20 Feb low, congestion | |
| R3 | 0.7205 | * | 61.8% 2021/2025 fall | S2 | 0.6950 | * | congestion | |
| R2 | 0.7147 | ** | 12 Feb YTD high | S3 | 0.6900 | ** | congestion, 6 Feb low | |
| R1 | 0.7100 | * | congestion | S4 | 0.6870 | * | 38.2% Nov/Feb rally |
Asterisk denotes strength of level
00:20 GMT - Volatile trade saw losses through the .7015/00 support before staging rebound to leave a long wick at the .6950 support. Further volatility can be expected but focus has tunred to the downside and see room for deeper retracement of the rally from .6420, November low. Ranging action above the .7015/00 area expected to meet with fresh selling pressure later to retest .6950 congestion and where break will open up room to the .6900 level. Meanwhile, resistance remains at the .7050/.7100 congestion which is expected to cap and sustain bearish bias from .7137/.7147 highs