Published: 2026-03-03T07:52:58.000Z
Chart AUD/JPY Update: Consolidating test of 112.00 level
1
Consolidation below the 111.50 high has given way break to extend the underlying bull trend to fresh multi-year high at the 112.00 congestion
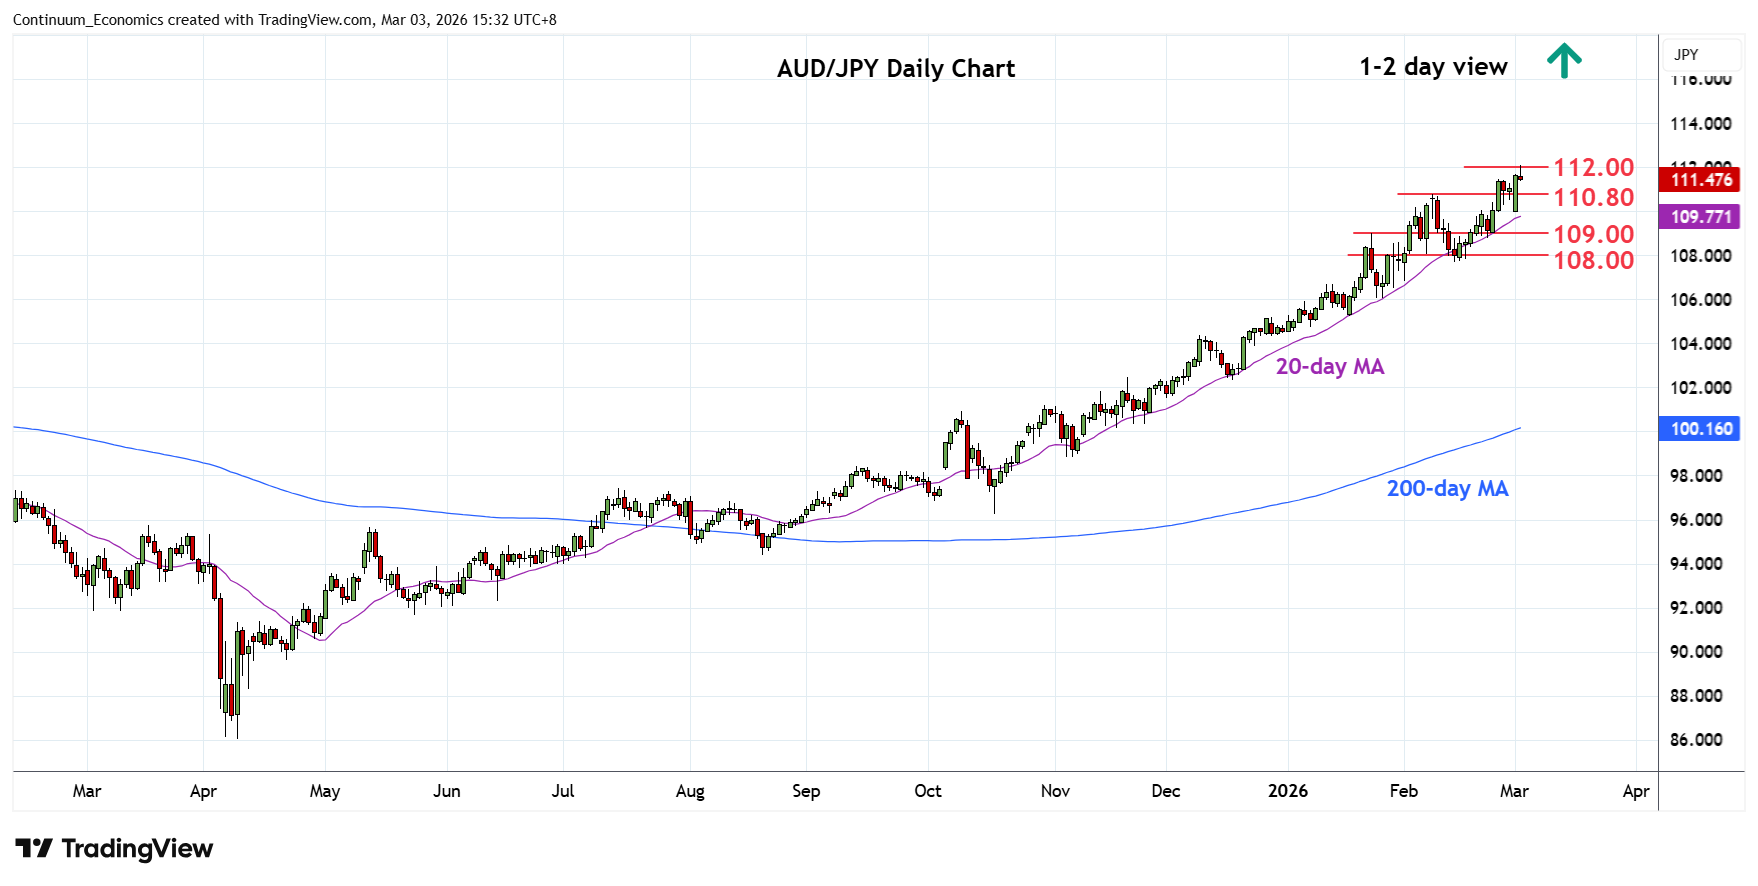
| Levels | Imp | Comment | Levels | Imp | Comment | |||
|---|---|---|---|---|---|---|---|---|
| R4 | 115.00 | * | congestion | S1 | 110.80 | * | 9 Feb high | |
| R3 | 114.00 | * | congestion | S2 | 110.00 | * | congestion | |
| R2 | 113.00 | * | congestion | S3 | 109.00 | ** | congestion, Jan high | |
| R1 | 112.00 | ** | congestion | S4 | 107.70 | ** | 13 Feb low |
Asterisk denotes strength of level
07:45 GMT - Consolidation below the 111.50 high has given way break to extend the underlying bull trend to fresh multi-year high at the 112.00 congestion from September 1990. Higher still will see room to 113.00/114.00 congestion area. However, deep overbought daily and weekly studies caution corrective pullback with support starting at the 110.80/110.00 area. Would take break here to open up room for deeper pullback to correct strong gains from the 86.05, April 2025 year low. Break will see room to the strong support at the 109.00 congestion and 108.00/107.80 area.