Chart USD/ZAR Update: Range extension - studies under pressure

Still little change, as mixed intraday studies keep near-term sentiment cautious
| Level | Comment | Level | Comment | |||||
|---|---|---|---|---|---|---|---|---|
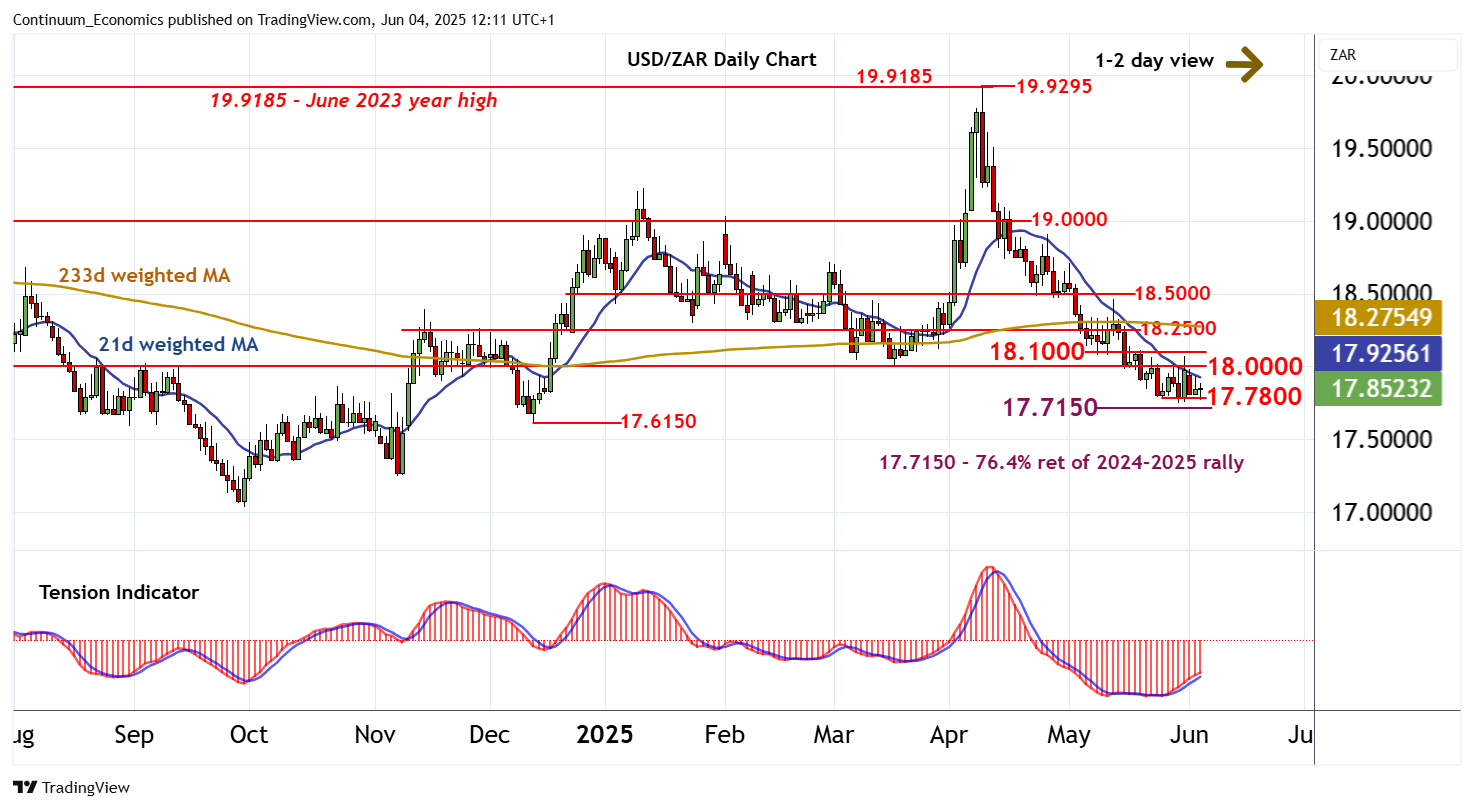
| R4 | 18.5000 | ** | break level | S1 | 17.7800 | ** | 26 May (w) low | |
| R3 | 18.2500 | * | congestion | S2 | 17.7150 | ** | 76.4% ret of 2024-2025 rally | |
| R2 | 18.1000 | * | break level | S3 | 17.6150 | ** | 12 Dec (m) low | |
| R1 | 18.0000 | ** | congestion | S4 | 17.5000 | * | congestion |
Asterisk denotes strength of level
12:00 BST - Still little change, as mixed intraday studies keep near-term sentiment cautious and extend consolidation around support at the 17.7800 weekly low of 26 May. Rising daily readings are now fading and broader weekly charts are coming under pressure, highlighting a deterioration in sentiment and room for fresh losses in the coming sessions. A break below 17.7800 will open up the 17.7150 Fibonacci retracement, with a further break beneath here turning sentiment negative and extending April losses towards the 17.6150 monthly low of 12 December. Meanwhile, resistance remains at congestion around 18.0000 and extends to 18.1000. This range should cap any immediate tests higher.