Published: 2026-01-07T07:36:55.000Z
Chart EUR/AUD Update: Extending losses
1
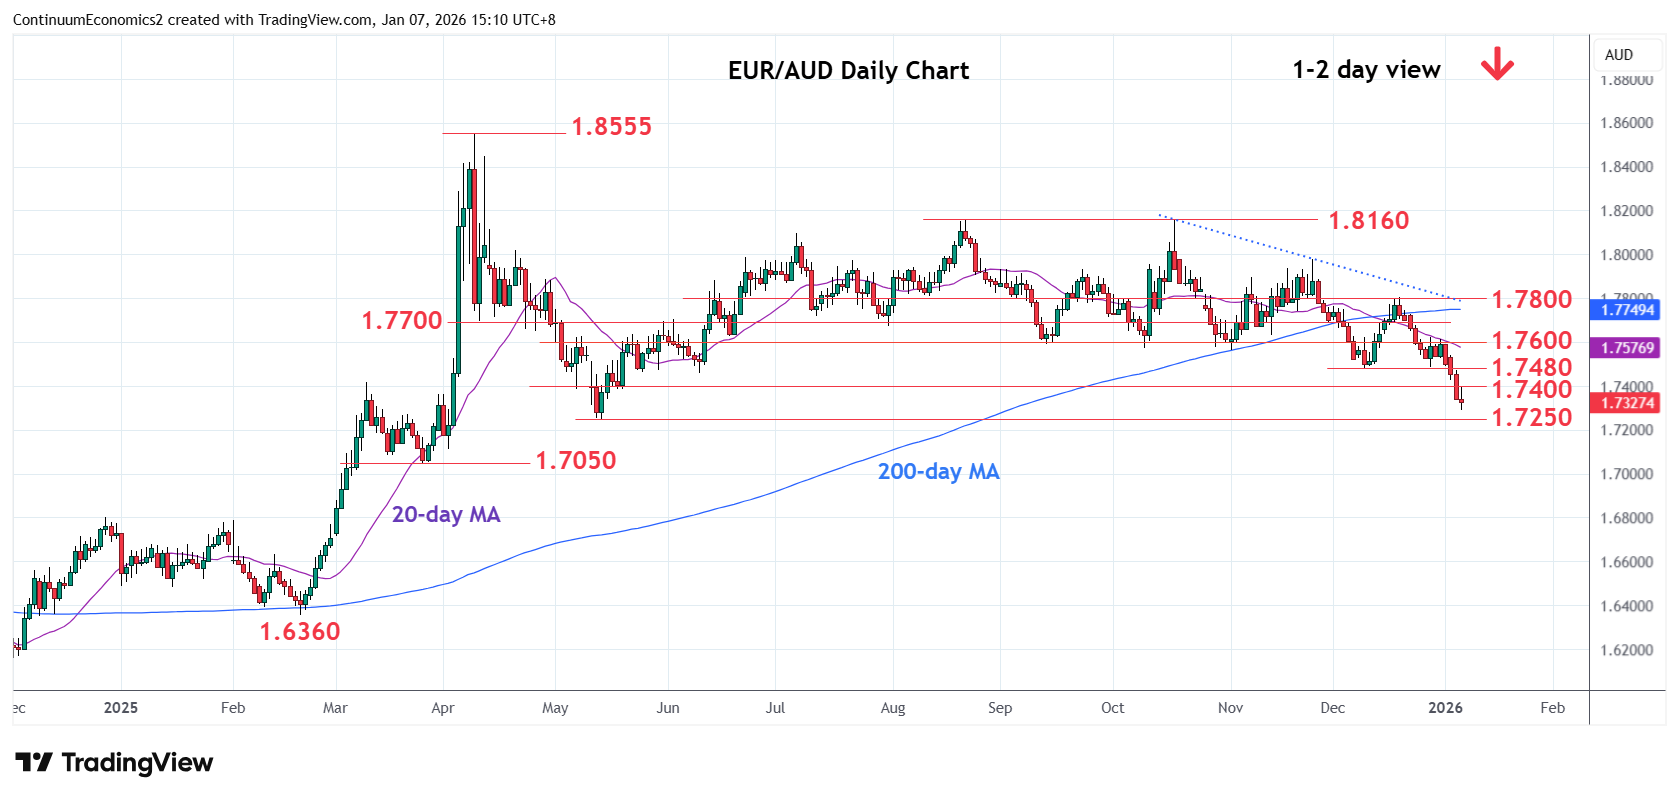
Break of the 1.7400 level see prices extending losses from the 1.8160, August/October double top
| Levels | Imp | Comment | Levels | Imp | Comment | |||
|---|---|---|---|---|---|---|---|---|
| R4 | 1.7600 | ** | congestion | S1 | 1.7260/50 | ** | 50% 2024/2025 rally, May low | |
| R3 | 1.7570 | * | Oct, Nov lows | S2 | 1.7200 | * | congestion | |
| R2 | 1.7480 | * | Dec low | S3 | 1.7110 | * | Apr low | |
| R1 | 1.7400 | * | congestion | S4 | 1.7050 | * | 26 Mar low |
Asterisk denotes strength of level
07:35 GMT - Break of the 1.7400 level see prices extending losses from the 1.8160, August/October double top. Negative daily studies keeps pressure firmly on the downside and lower will see room for extension to strong support at 1.7260/50, 50% Fibonacci level and May low where reaction can be expected to unwind oversold daily and weekly studies. Meanwhile, resistance is lowered to the 1.7400 congestion which extend to the December low at 1.7480. This area now expected to cap and only above here will see room for stronger corrective bounce to 1.7570/1.7600, October/November lows.