Chartbook: US Chart 10 Year Yield: Choppy trade - background studies leaning lower
The anticipated break below congestion support at 4.000% posted a fresh 2025 year low at 3.860%
The anticipated break below congestion support at 4.000% posted a fresh 2025 year low at 3.860%,
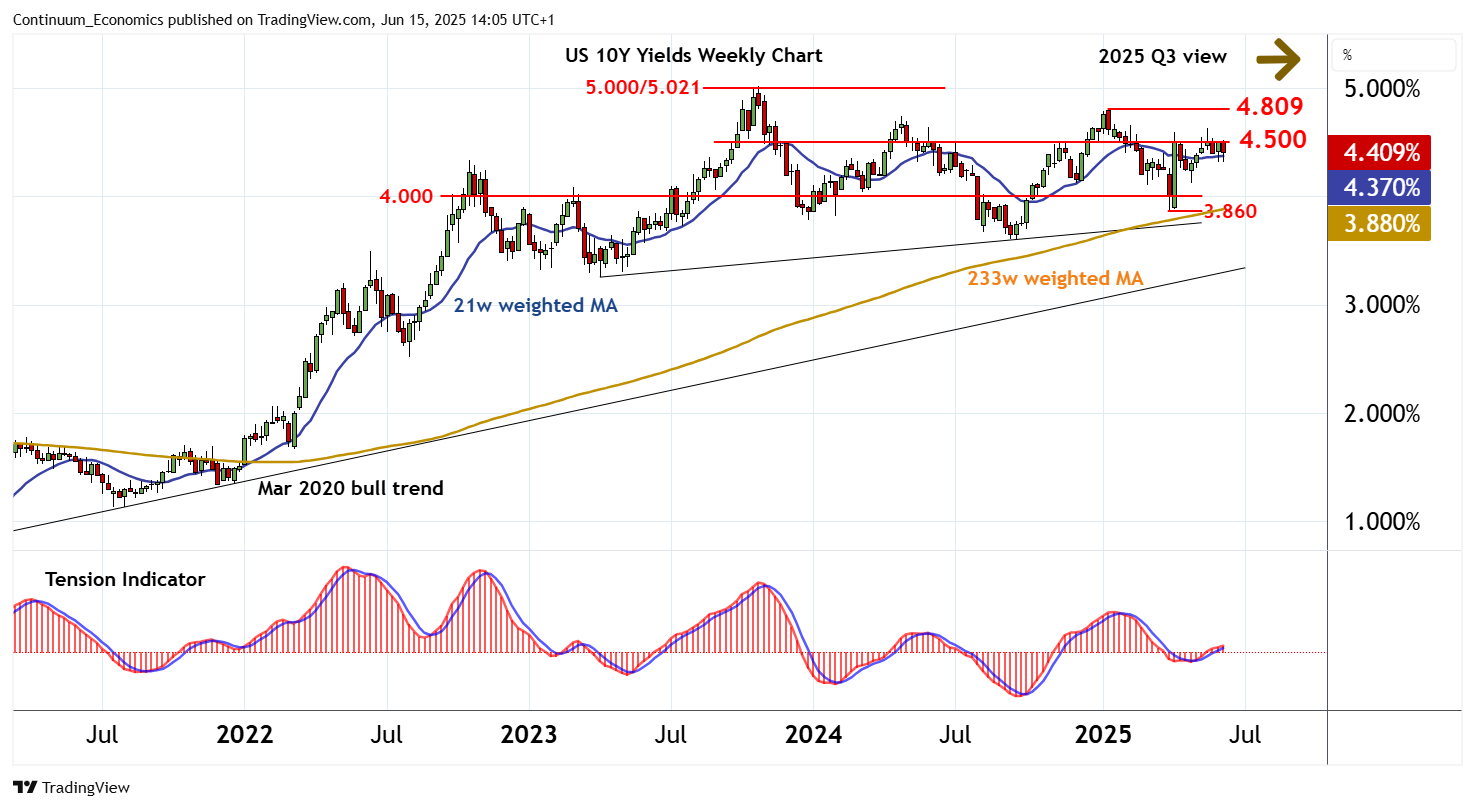
before bouncing sharply into extended consolidation beneath congestion around 4.500%.
The weekly Tension Indicator is edging higher, suggesting room for a test above here. But negative weekly stochastics are expected to limit scope in renewed selling interest towards strong resistance at the 4.809% current year high of 14 January.
Critical resistance is at congestion around 5.000% and the 5.02% year high of October 2023. A close above here is needed to turn sentiment positive and confirm continuation of the March 2020 bull trend.
Following any tests higher, negative monthly charts are expected to add pressure to price action and prompt fresh tests lower.
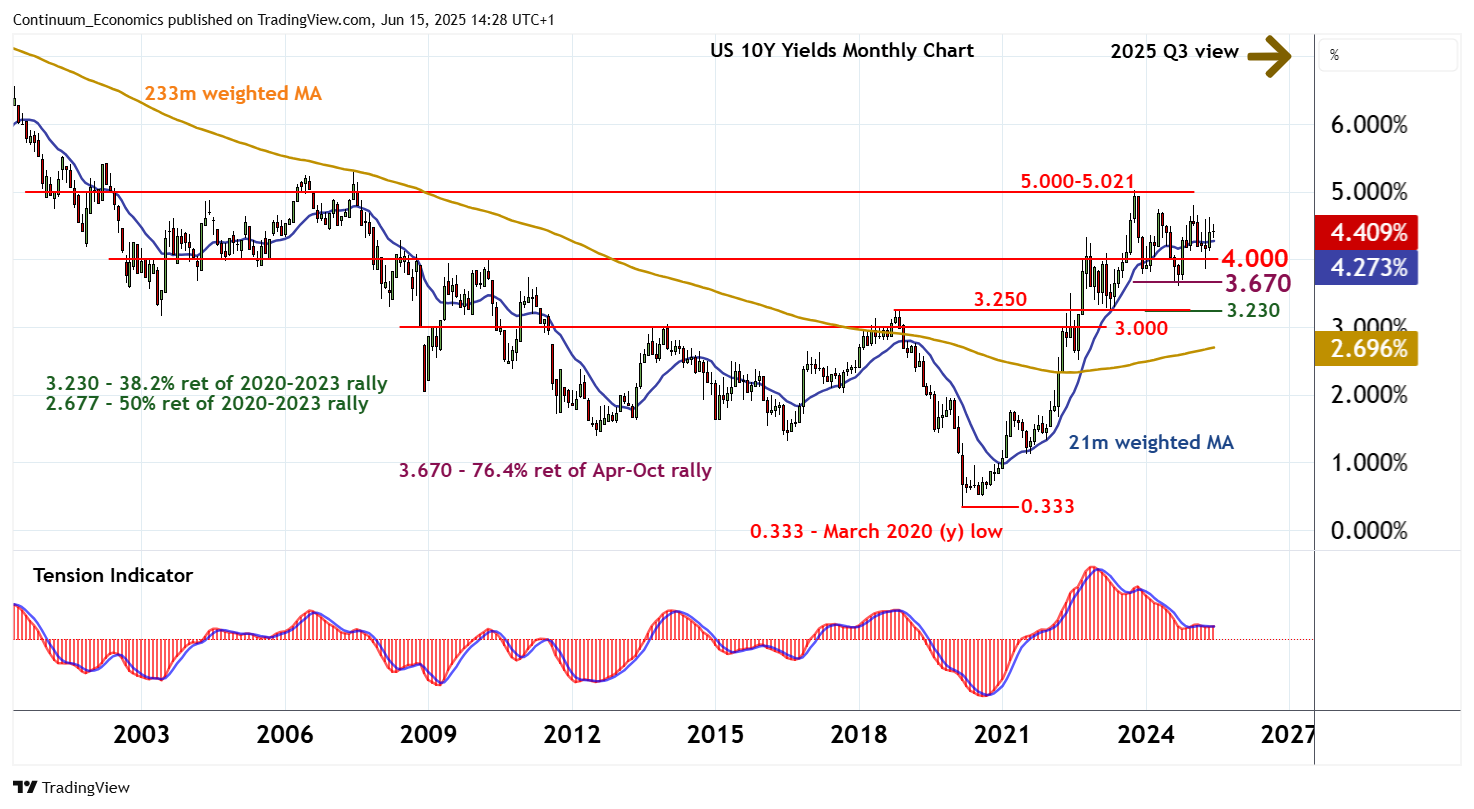
Support remains at congestion around 4.000%. A break beneath here will add weight to sentiment and open up critical support at the 3.670% Fibonacci retracement and the 3.599% year low of September 2024.
A test of this tight range cannot be ruled out, but mixed longer-term charts are expected to prompt consolidation above here.
A close beneath here, however, would turn sentiment negative and give way to lower Yields, as prices correct the 2020-2023 rally.