Chart USD Index DXY Update: Leaning lower
The test of resistance within 100.00/26 has been pushed back from 100.36
| Levels | Imp | Comment | Levels | Imp | Comment | |||
|---|---|---|---|---|---|---|---|---|
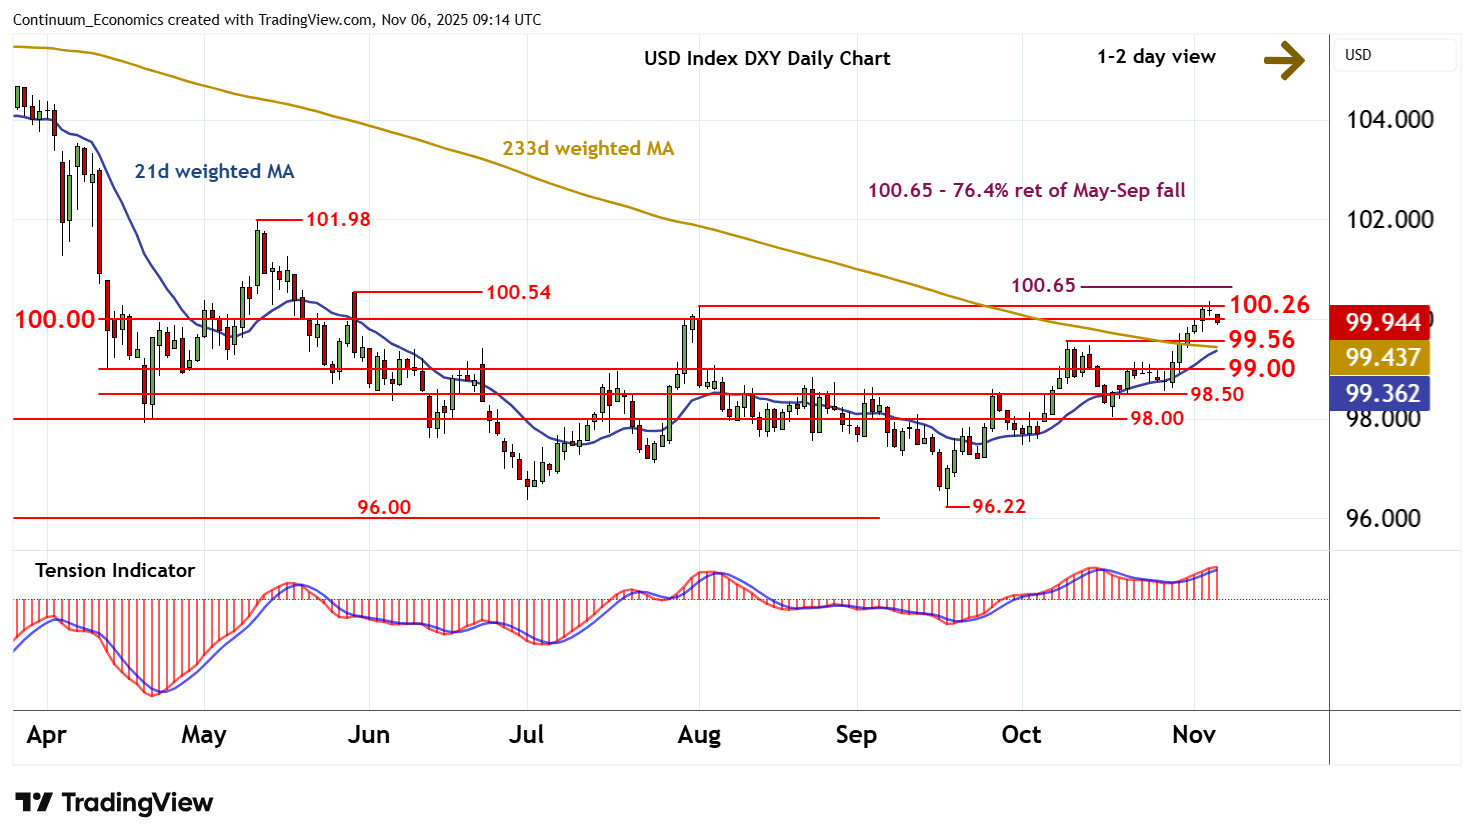
| R4 | 100.65 | ** | 76.4% ret of May-Sep fall | S1 | 99.56 | ** | 9 Oct (w) high | |
| R3 | 100.54 | ** | 29 May (w) high | S2 | 99.00 | * | congestion | |
| R2 | 100.26 | ** | 1 Aug (m) high | S3 | 98.50 | * | congestion | |
| R1 | 100.00 | ** | congestion | S4 | 98.00 | * | congestion |
Asterisk denotes strength of level
09:00 GMT - The test of resistance within 100.00/26 has been pushed back from 100.36, as intraday studies turn down, with prices currently trading around 99.95. Overbought daily stochastics are also unwinding and the positive daily Tension Indicator is flattening, suggesting a cautious tone and room for further losses. Focus is expected to turn to support at the 99.56 weekly high of 9 October. But rising weekly charts should limit any initial tests in consolidation. Following cautious trade, fresh gains are looked for. However, a close above the 100.26 monthly high of 1 August is needed to improve sentiment and extend mid-September gains initially to the 100.54 weekly high of 29 May and the 100.65 Fibonacci retracement.