Published: 2026-04-29T13:02:47.000Z
Chart USD/JPY Update: Pushing higher
2
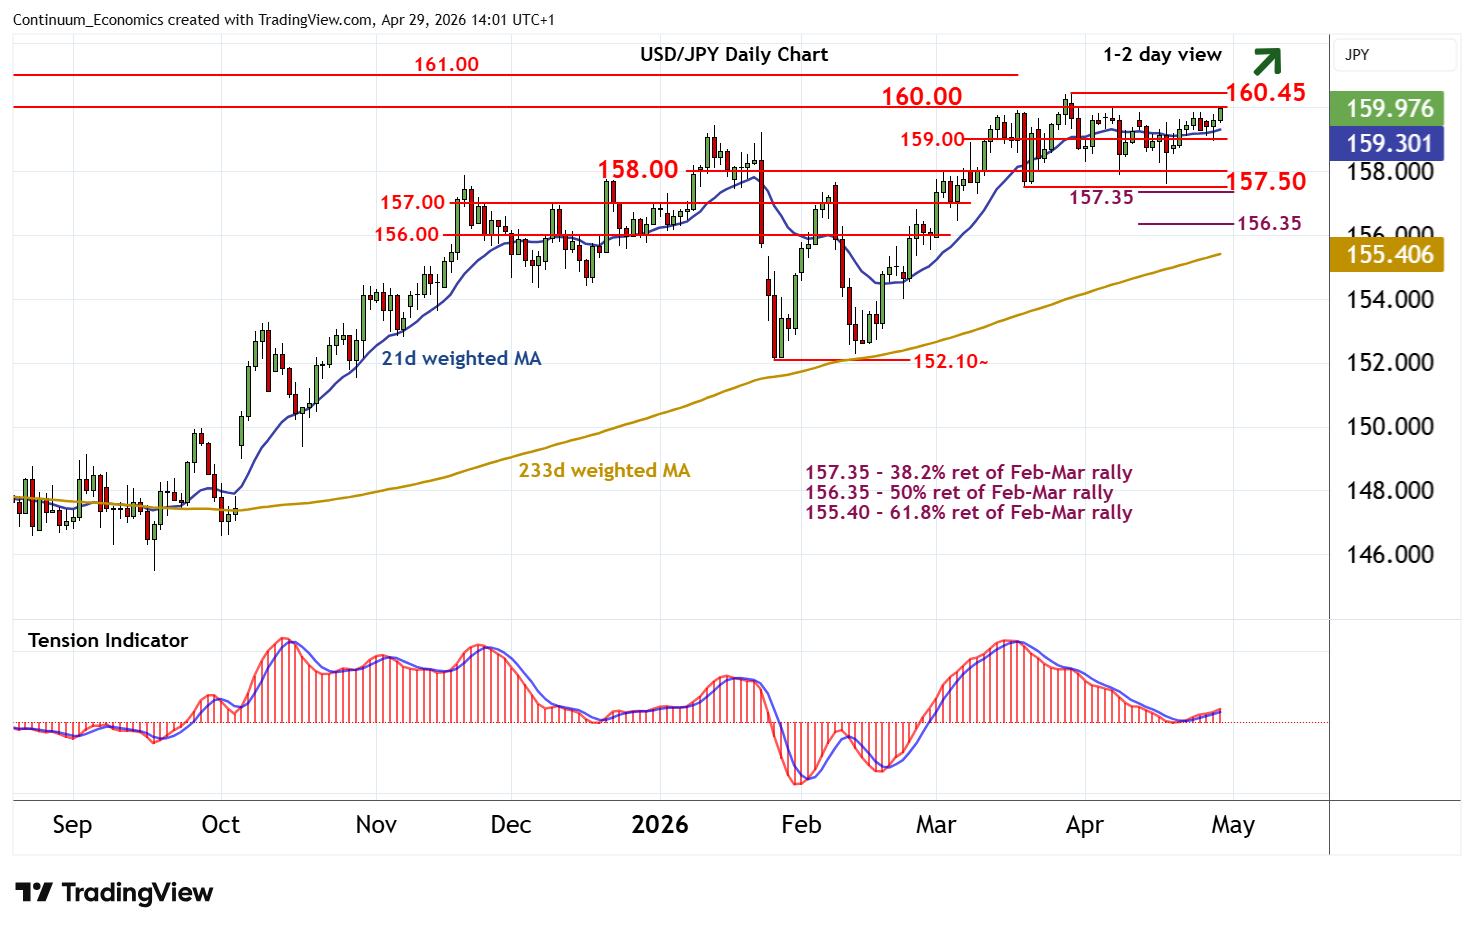
The anticipated test below congestion support at 159.00 has not been seen
| Levels | Imp | Comment | Levels | Imp | Comment | |||
|---|---|---|---|---|---|---|---|---|
| R4 | 161.95 | * | June 2024 (y) high | S1 | 159.00 | * | congestion | |
| R3 | 161.00 | * | July 2024 congestion | S2 | 158.00 | ** | congestion | |
| R2 | 160.45 | ** | 30 Mar YTD high | S3 | 157.35/50 | ** | 38.2% ret; 19 Mar (w) low | |
| R1 | 160.00 | ** | historic congestion | S4 | 157.00 | * | congestion |
Asterisk denotes strength of level
13:45 BST - The anticipated test below congestion support at 159.00 has not been seen, as intraday studies turn higher and prompt steady gains to congestion resistance at 160.00. Daily readings have ticked higher and broader weekly charts are improving, suggesting room for further gains in the coming sessions. However, a close above the 160.45 current year high of 30 March is needed to turn sentiment positive and extend September 2024 gains towards the 161.95 multi-year high of June 2024. Meanwhile, a close below 159.00 would stabilise price action and prompt consolidation above further congestion around 158.00.