Published: 2026-03-03T00:47:46.000Z
Chart NZD/USD Update: Extending January losses
1
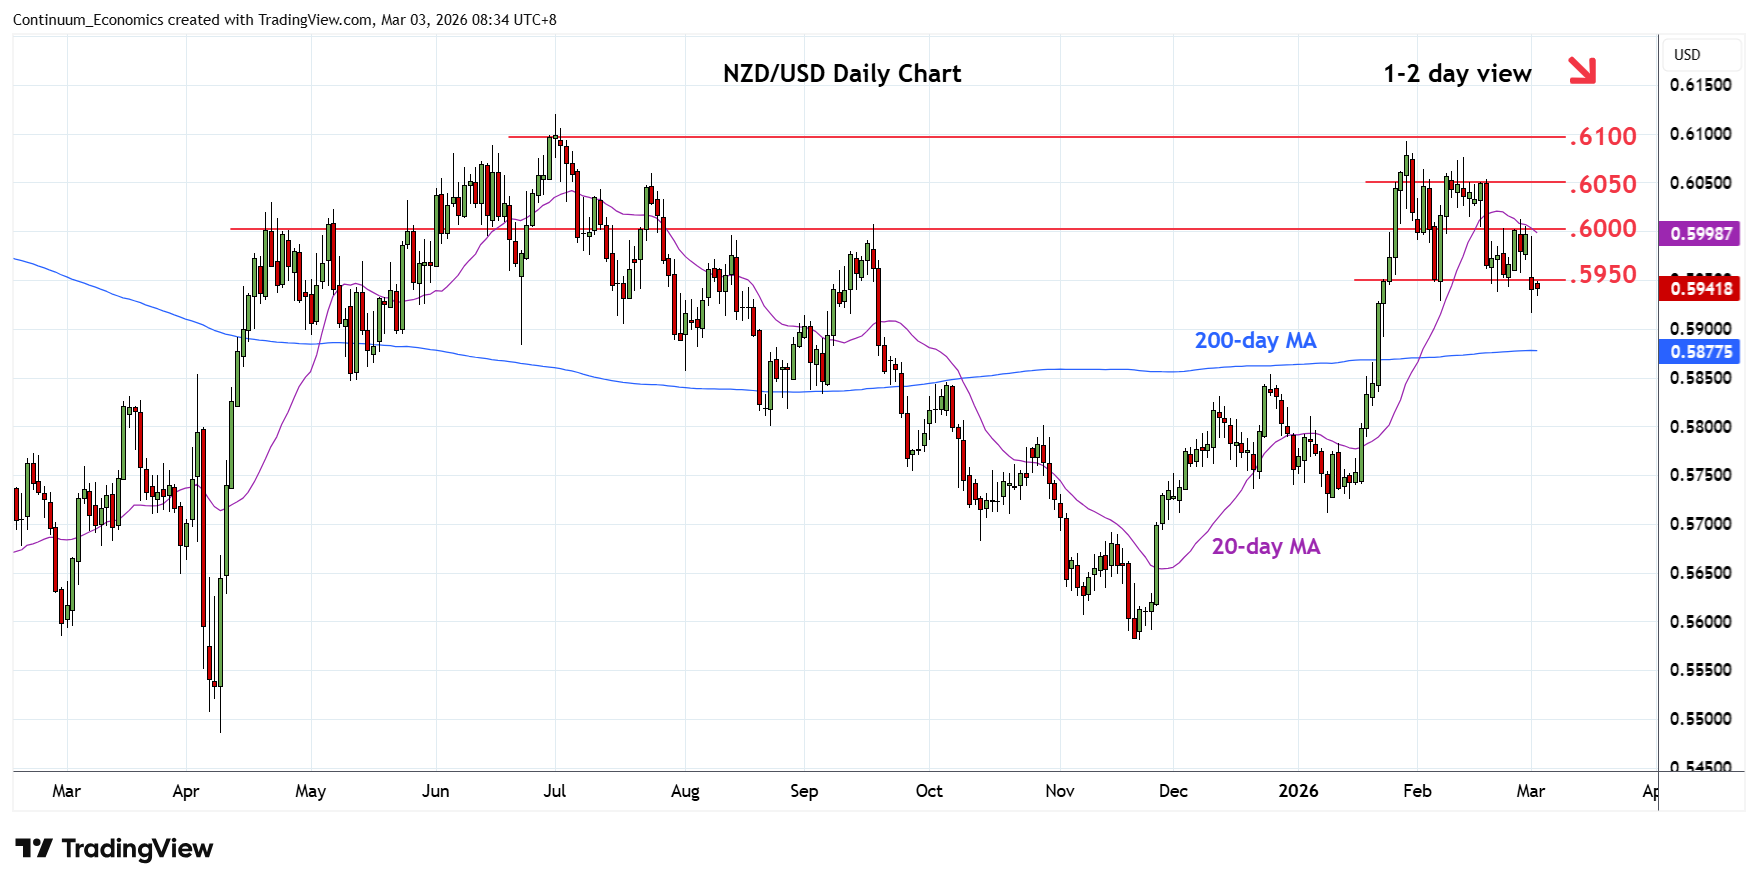
Saw break of support at the .5950 congestion as prices extend losses from the January high to reach .5916 low
| Levels | Imp | Comment | Levels | Imp | Comment | |||
|---|---|---|---|---|---|---|---|---|
| R4 | .6093 | ** | 29 Jan YTD high | S1 | .5900 | * | 50% Jan rally | |
| R3 | .6050 | * | congestion | S2 | .5853/00 | ** | Dec high, congestion | |
| R2 | .6000 | ** | figure, congestion | S3 | .5800 | * | 76.4% Jan rally | |
| R1 | .5950 | * | congestion | S4 | .5750 | * | congestion |
Asterisk denotes strength of level
00:40 GMT - Saw break of support at the .5950 congestion as prices extend losses from the January high to reach .5916 low. Consolidation here see prices unwinding oversold intraday studies but the negative daily and weekly studies keep pressure on the downside and see room for extension to the .5900, 50% Fibonacci level. Lower still, will open up room to the strong support at the .5850 congestion and 76.4% Fibonacci level. Meanwhile, resistance at the .5950/.6000 congestion is expected to cap. Regaining this needed to fade the downside pressure and revive the upside focus.