Published: 2026-01-27T06:59:02.000Z
Chart USD Index DXY Update: Consolidating at 97.00
-
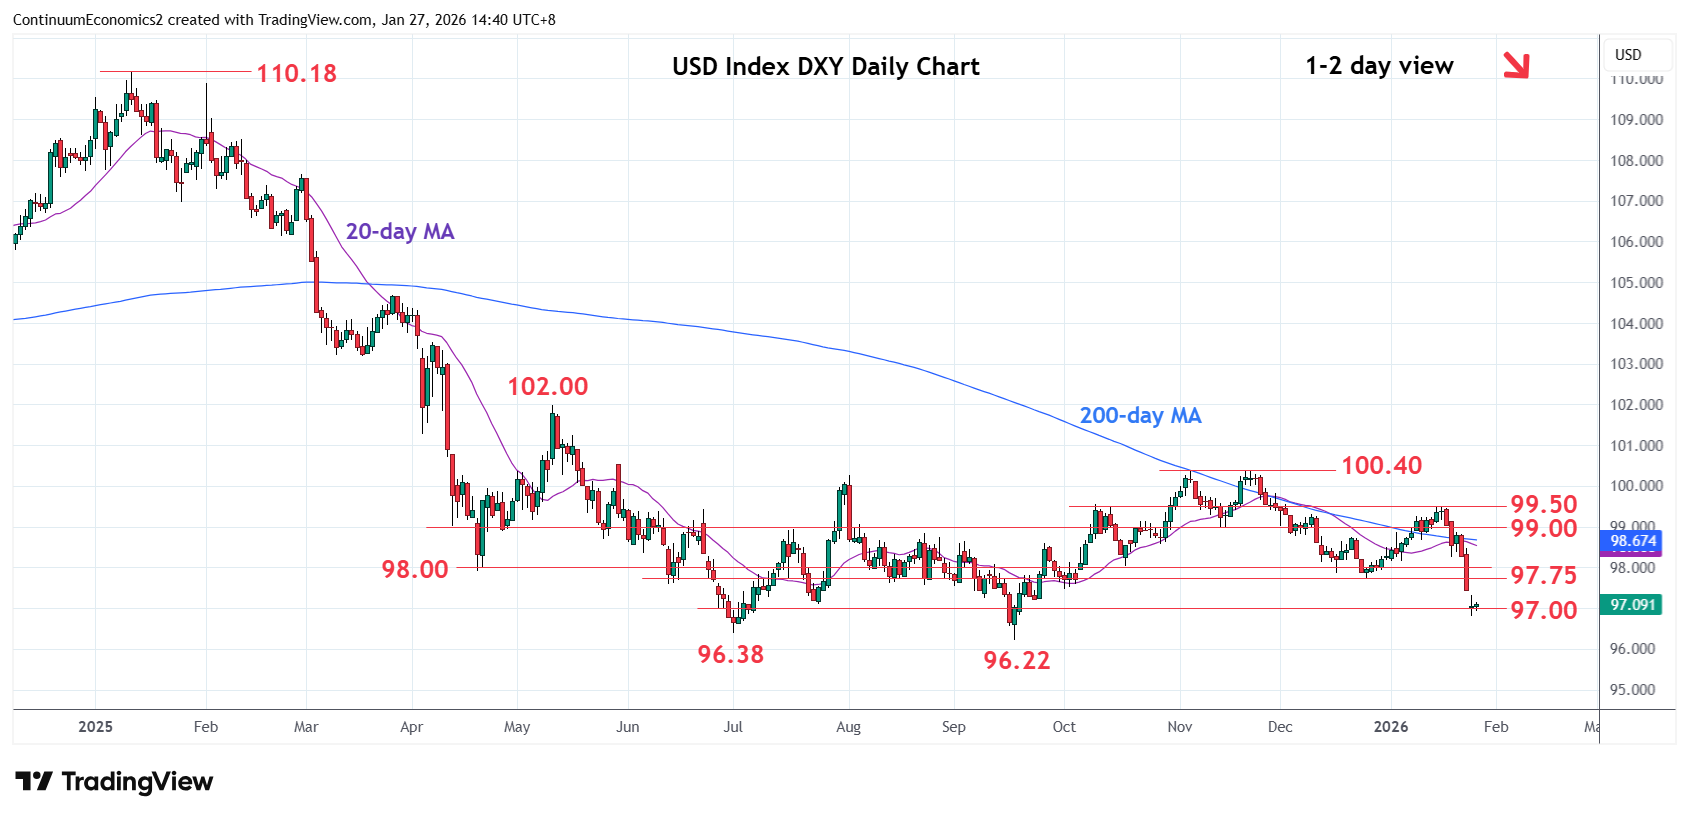
Limited on break of the 97.00 level as prices turned up from the 96.80 low to consolidate sharp losses last week
| Levels | Imp | Comment | Levels | Imp | Comment | |||
|---|---|---|---|---|---|---|---|---|
| R4 | 99.00 | ** | congestion | S1 | 97.00 | * | congestion | |
| R3 | 98.25 | * | 20 Jan low | S2 | 96.38 | * | Jul low | |
| R2 | 98.00 | * | congestion | S3 | 96.22 | ** | Sep 2025 year low | |
| R1 | 97.75 | ** | Dec low | S4 | 95.25 | * | 76.4% 2021/2022 rally |
Asterisk denotes strength of level
06:50 GMT - Limited on break of the 97.00 level as prices turned up from the 96.80 low to consolidate sharp losses last week and unwind the oversold intraday studies. Daily and weekly studies continues to track lower and highlights room for further losses. Lower will see room to retest the 96.38 and 96.22, July and September 2025 year low. Would expect reaction at these lows to consolidate losses from the October swing high. Meanwhile, resistance at the 97.75/98.00 December low and congestion area are expected to cap. Clearance will open up room for stronger bounce to 98.25/99.00 area.