Published: 2025-04-24T08:29:48.000Z
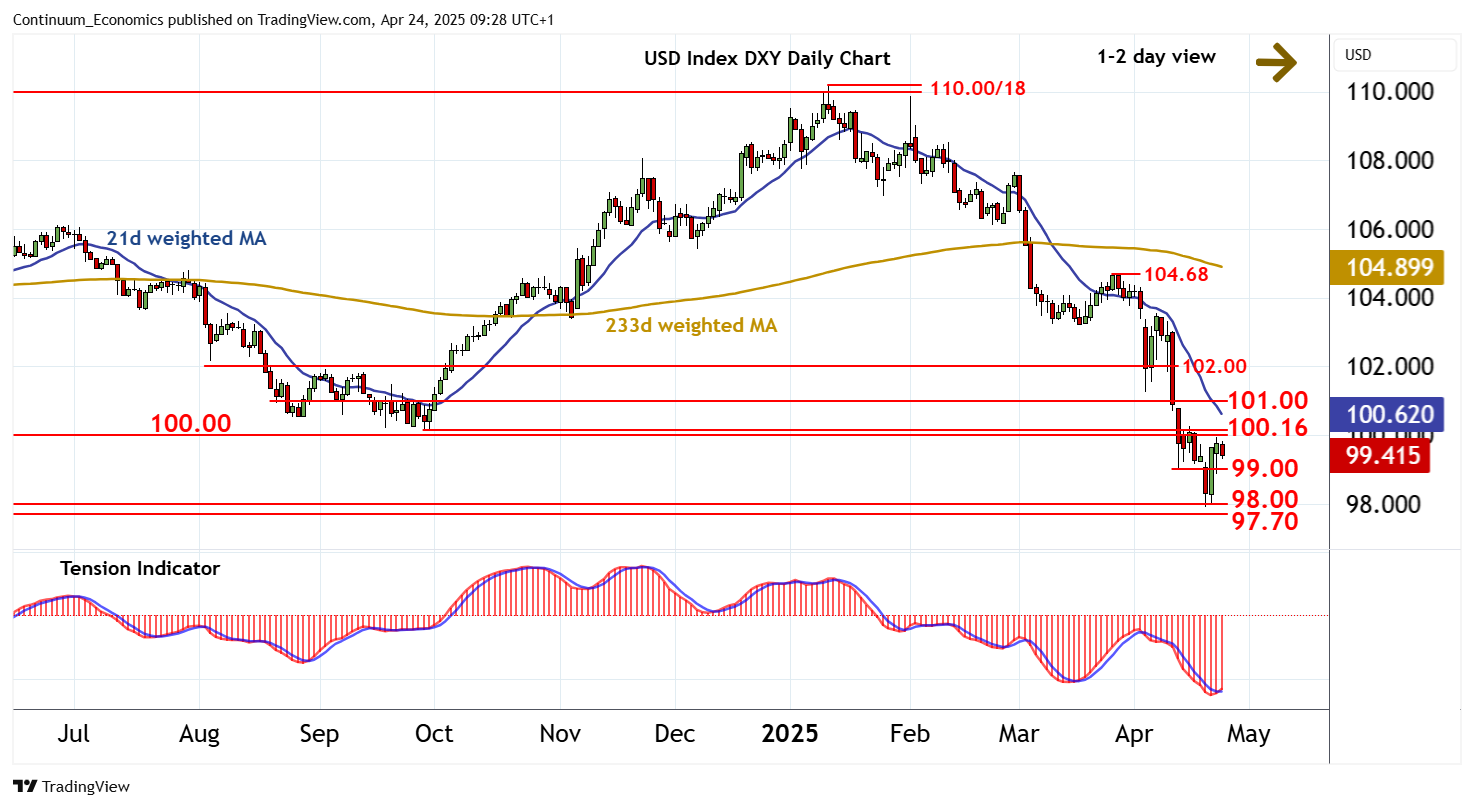
Chart USD Index DXY Update: Cautious trade - daily studies rising

Senior Technical Strategist
-
Anticipated gains have met selling interest just beneath congestion resistance at 100.00
| Levels | Imp | Comment | Levels | Imp | Comment | |||
|---|---|---|---|---|---|---|---|---|
| R4 | 102.00 | ** | break level | S1 | 99.00 | break level | ||
| R3 | 101.00 | * | break level | S2 | 98.00 | * | congestion | |
| R2 | 100.16 | ** | 27 Sep 2024 (y) low | S3 | 97.70 | * | Feb-Mar 2022 break level | |
| R1 | 100.00 | ** | congestion | S4 | 96.50 | * | congestion |
Asterisk denotes strength of level
09:20 BST - Anticipated gains have met selling interest just beneath congestion resistance at 100.00, as overbought intraday studies unwind, with prices settling back and currently trading around 99.45. A test of support at 99.00 cannot be ruled out. But rising daily readings are expected to limit any break in renewed buying interest above congestion support at 98.00. Meanwhile, resistance remains at 100.00 and extends to the 100.16 year low of 27 September 2024. A close above here will open up the 101.00 break level. But negative weekly charts are expected to limit any initial tests in renewed consolidation.