Chart EUR/CAD Update: Balanced at support - studies under pressure

The anticipated test of support within congestion around 1.5900 and the 1.5929 weekly low of 3 July is giving way to consolidation
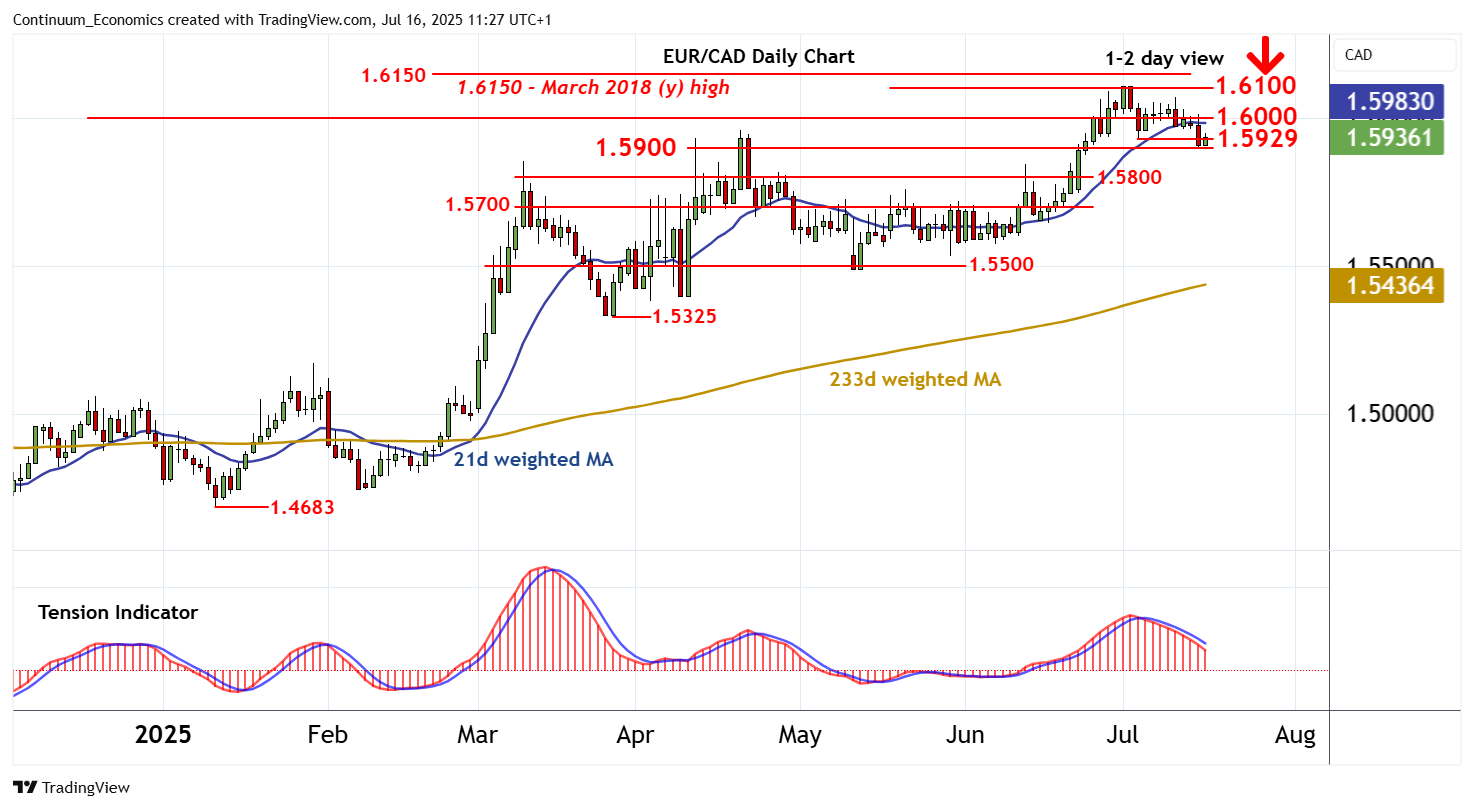
| Level | Comment | Level | Comment | |||||
|---|---|---|---|---|---|---|---|---|
| R4 | 1.6200 | historic congestion | S1 | 1.5929 | * | 3 Jul (w) low | ||
| R3 | 1.6150~ | ** | March 2018 (y) high | S2 | 1.5900 | congestion | ||
| R2 | 1.6100/09 | * | cong; 1 Jul YTD high | S3 | 1.5800 | congestion | ||
| R1 | 1.6000 | ** | congestion | S4 | 1.5700 | break level |
Asterisk denotes strength
11:15 BST - The anticipated test of support within congestion around 1.5900 and the 1.5929 weekly low of 3 July is giving way to consolidation, as oversold intraday studies unwind and oversold daily stochastics flatten. The daily Tension Indicator continues to track lower, highlighting room for later losses towards the 1.5929 weekly low of 3 July. However, broader weekly stochastics are unwinding overbought areas and the weekly Tension Indicator is also turning down, pointing to room for a later break. A close beneath here will add weight to sentiment and extend July losses below congestion around 1.5900 towards 1.5800. Meanwhile, resistance remains at congestion around 1.6000. A close above here, if seen, would help to stabilise sentiment and give way to fresh consolidation beneath critical resistance at 1.6100/09.