Published: 2025-06-09T16:12:13.000Z
Chart USD/MXN Update: Extending February losses

Senior Technical Strategist
2
Minor tests higher have given way to anticipated losses
| Levels | Imp | Comment | Levels | Imp | Comment | |||
|---|---|---|---|---|---|---|---|---|
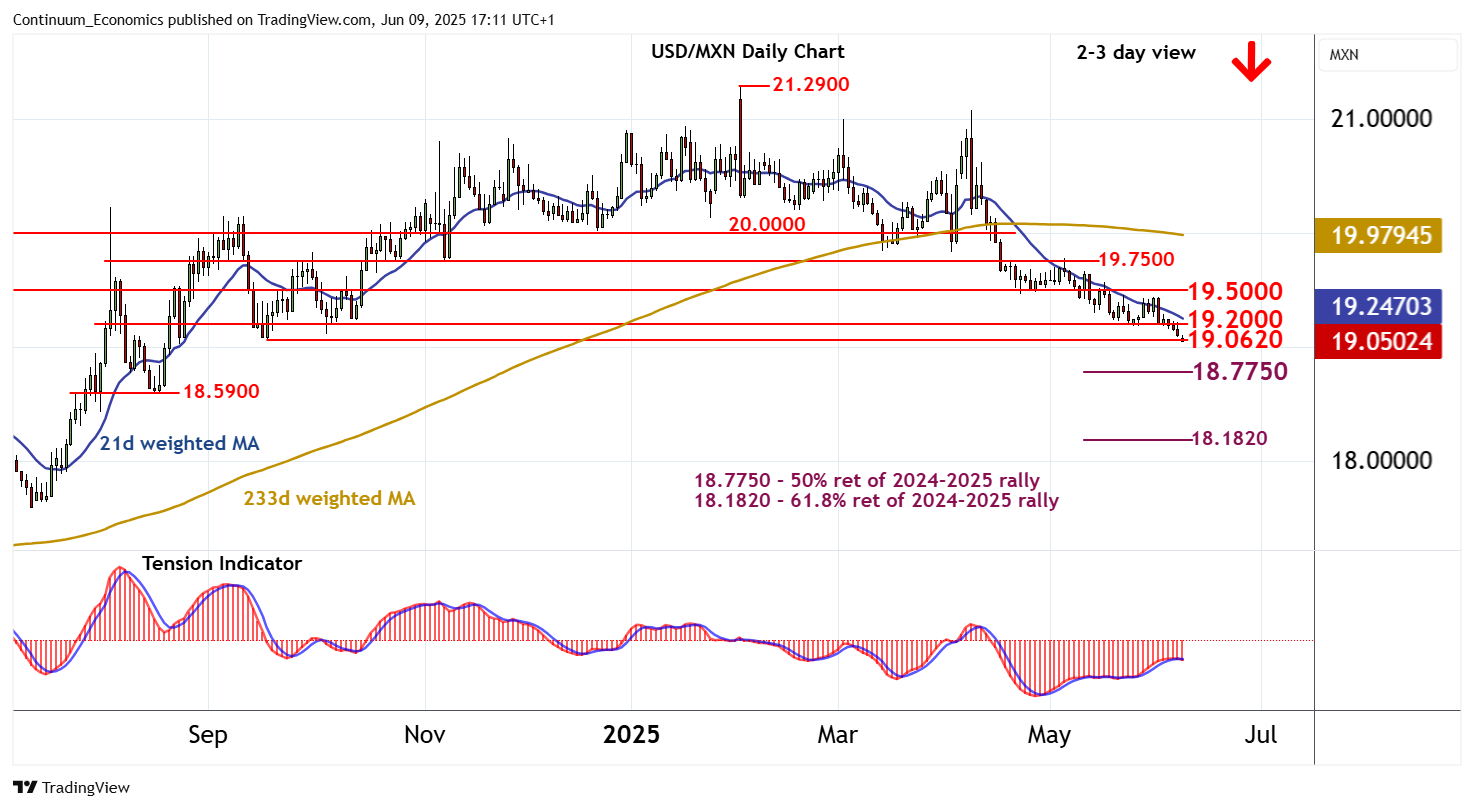
| R4 | 19.7800 | * | 6 May high | S1 | 19.0620 | * | 18 Sep (m) low | |
| R3 | 19.7000 | * | congestion | S2 | 19.0000 | ** | congestion | |
| R2 | 19.5000 | * | congestion | S3 | 18.7750 | ** | 50% ret of 2024-2025 rally | |
| R1 | 19.2000 | * | congestion | S4 | 18.5900 | ** | 19 Aug 2024 (w) low |
Asterisk denotes strength of level
16:55 BST - Minor tests higher have given way to anticipated losses, with prices currently posting fresh 2025 year lows around strong support at the 19.0620 monthly low of 18 September. Daily readings have turned down and broader weekly charts are under pressure, highlighting room for still further losses in the coming sessions. A close beneath here will confirm continuation of February losses and open up a test of the 18.7750 Fibonacci retracement. Meanwhile, resistance is lowered to congestion around 19.2000. An unexpected close above here will help to stabilise price action and prompt consolidation beneath further congestion around 19.5000.