Chart USD Index DXY Update: Gains to remain limited

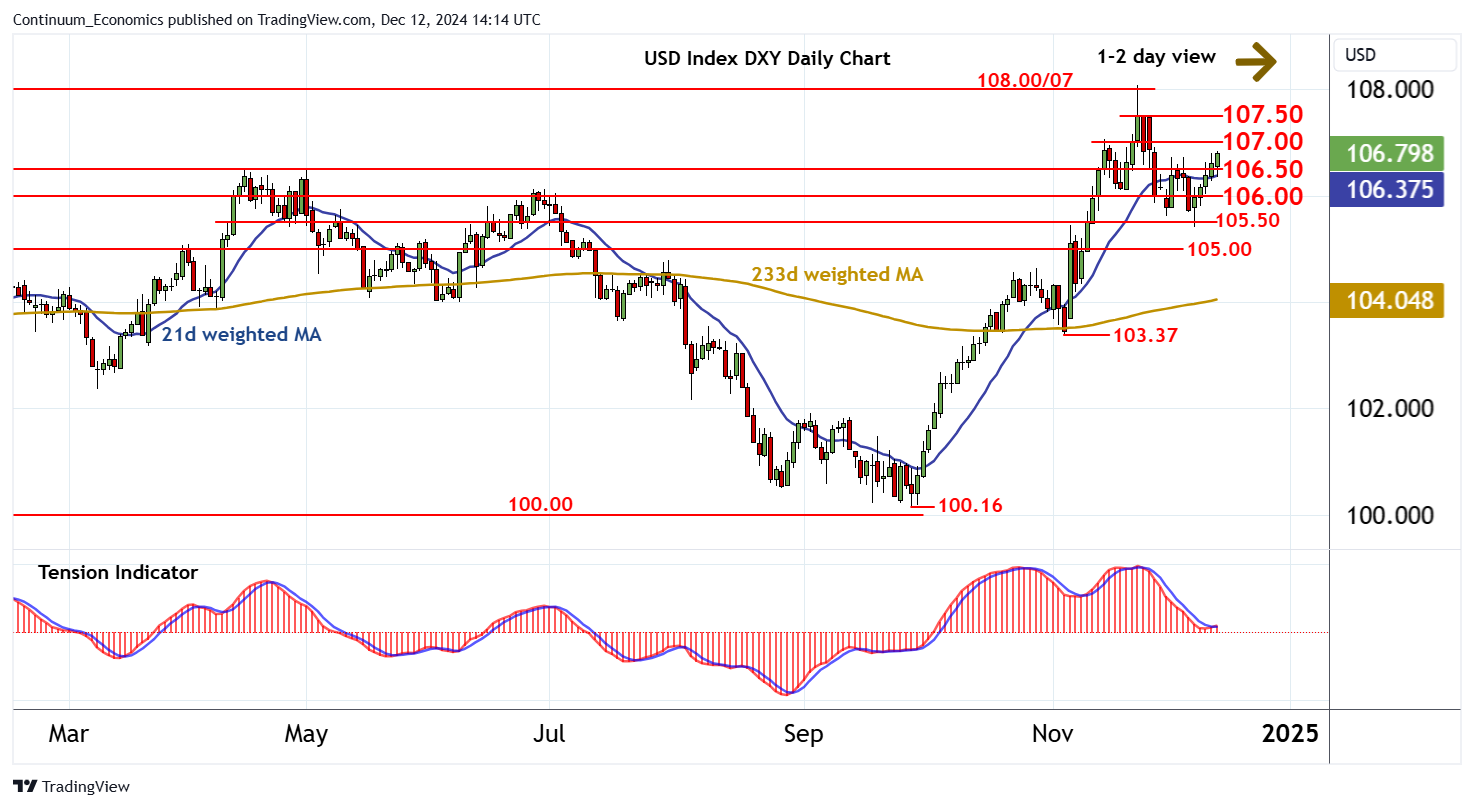
Little change, as prices extend consolidation above congestion support at 106.50

| Levels | Imp | Comment | Levels | Imp | Comment | |||
|---|---|---|---|---|---|---|---|---|
| R4 | 109.00 | ** | 61.8% ret of 2022-2023 fall | S1 | 106.50 | ** | congestion | |
| R3 | 108.00/07 | * | figure; 22 Nov YTD high | S2 | 106.00 | * | break level | |
| R2 | 107.50 | intraday break level | S3 | 105.50 | * | congestion | ||
| R1 | 107.00 | * | break level | S4 | 105.00 | ** | congestion |
Asterisk denotes strength of level
13:55 GMT - Little change, as prices extend consolidation above congestion support at 106.50. Oversold daily stochastics continue to unwind, suggesting room for continuation towards resistance at the 107.00 break level. But the negative daily Tension Indicator and deteriorating weekly charts should prompt renewed selling interest towards here. A break above 107.00, however, would extend corrective gains towards 107.50, where stronger selling interest is looked for. Following corrective gains, fresh losses are looked for. A later break back below support at 106.00 will add weight to sentiment. But a further close below congestion support at 105.50 is needed to turn sentiment negative and extend November losses initially to further congestion around 105.00.