Published: 2025-04-17T07:31:26.000Z
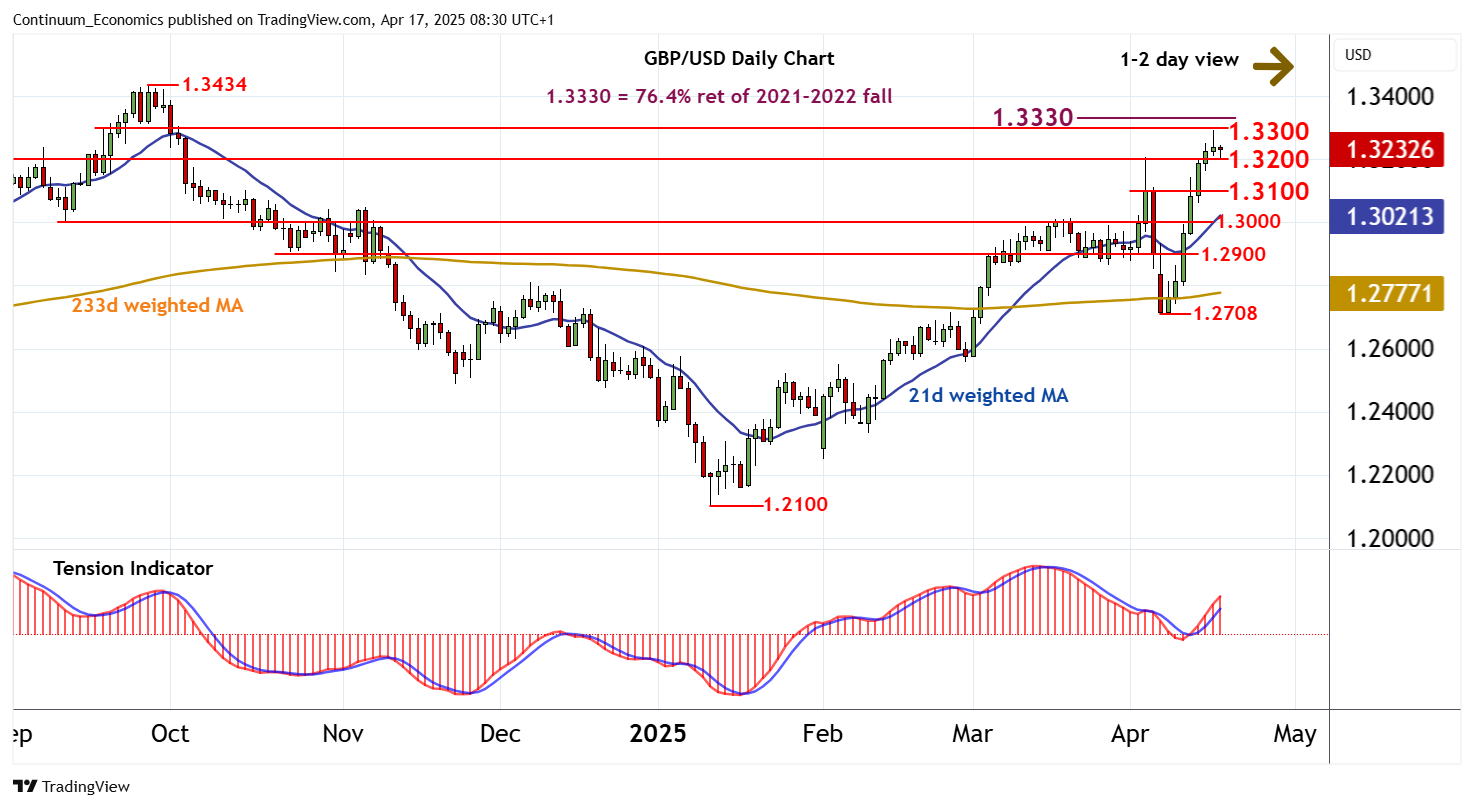
Chart GBP/USD Update: Turning away from strong resistance at 1.3300/30

Senior Technical Strategist
1

Anticipated tests higher have met selling interest just beneath resistance at the 1.3300 range highs

| Level | Comment | Level | Comment | |||||
|---|---|---|---|---|---|---|---|---|
| R4 | 1.3500 | ** | congestion | S1 | 1.3200 | ** | break level | |
| R3 | 1.3434 | ** | 26 Sep 2024 (y) high | S2 | 1.3100 | minor congestion | ||
| R2 | 1.3330 | ** | 76.4% ret of 2021-2022 fall | S3 | 1.3000 | ** | range highs | |
| R1 | 1.3300 | range highs | S4 | 1.2900 | ** | congestion |
Asterisk denotes strength of level
08:10 BST - Anticipated tests higher have met selling interest just beneath resistance at the 1.3300 range highs. Steady losses have reached support at 1.3200, where flattening oversold intraday studies are prompting a minor bounce. Rising daily stochastics are flattening in overbought areas, suggesting potential for a test below 1.3200. But the positive daily Tension Indicator and rising weekly charts are expected to limit any losses in renewed buying interest above congestion support at 1.3100. Following corrective trade, fresh gains are looked for. But a close above 1.3300 and the 1.3330 Fibonacci retracement is needed to turn sentiment positive and extend January gains towards critical resistance at the 1.3434 year high of 26 September 2024.