Published: 2025-12-23T05:51:02.000Z
Chart EUR/AUD Update: Extending pullback from 1.7800/20 resistance
1
Extending rejection from resistance at the 1.7800/20 congestion and 61.8% Fibonacci level as prices unwind overbought daily studies
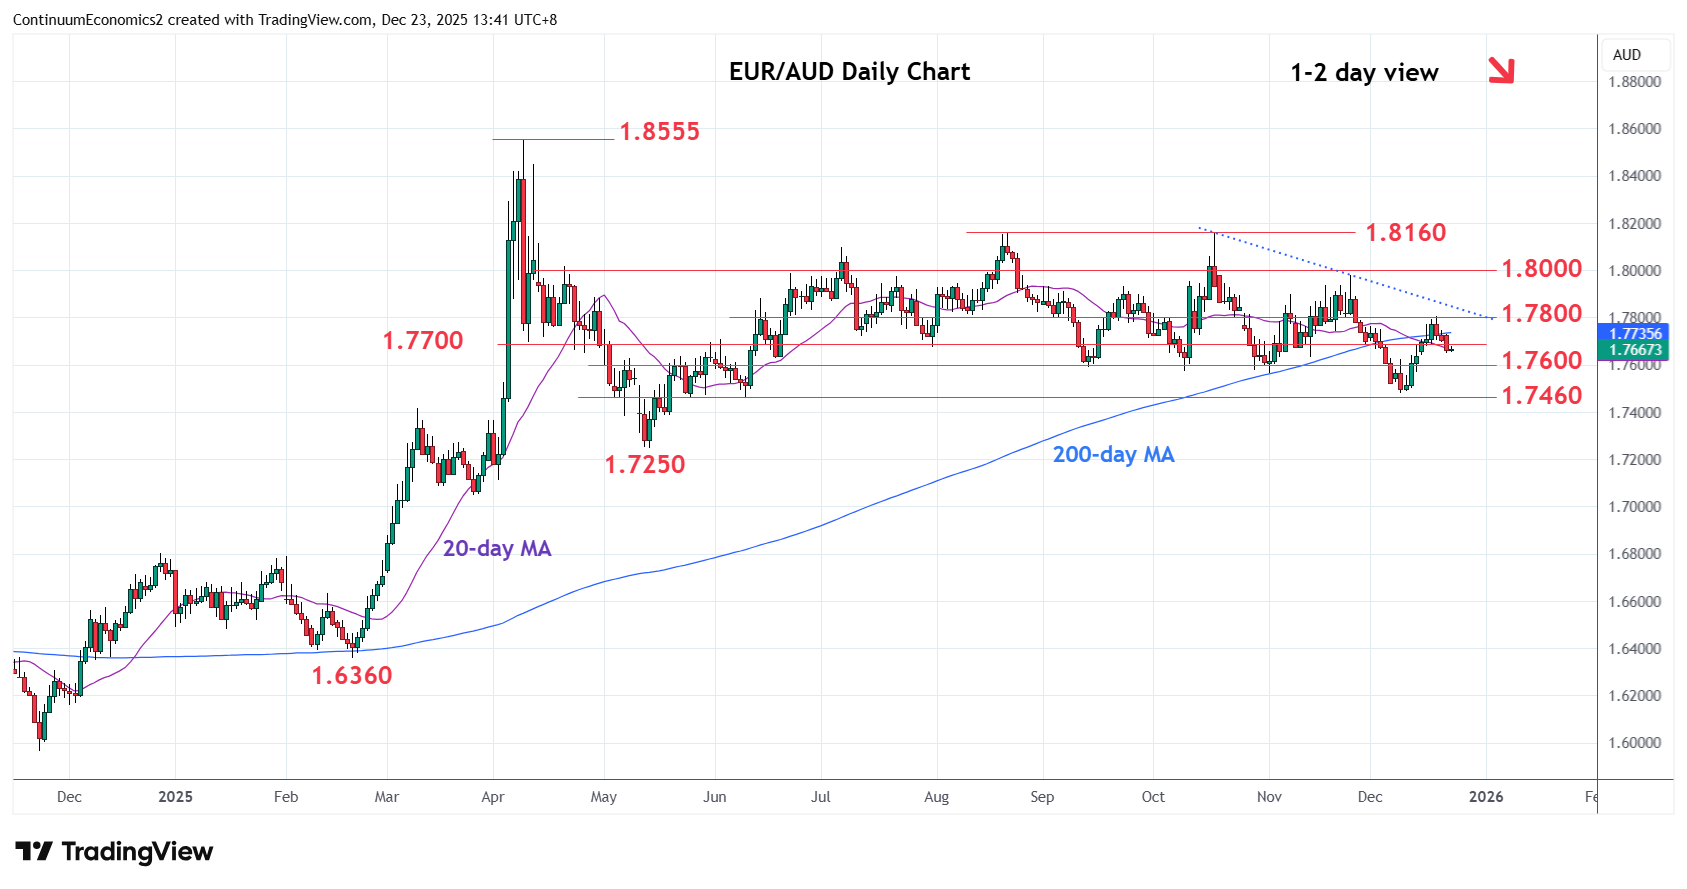
| Levels | Imp | Comment | Levels | Imp | Comment | |||
|---|---|---|---|---|---|---|---|---|
| R4 | 1.8160 | ** | Aug, Oct highs | S1 | 1.7600 | * | congestion | |
| R3 | 1.7978/00 | ** | 25 Nov high, congestion | S2 | 1.7480 | ** | 9 Dec low | |
| R2 | 1.7900 | * | congestion, 61.8% | S3 | 1.7400 | * | congestion | |
| R1 | 1.7800/20 | * | congestion, 50% | S4 | 1.7250 | ** | May low |
Asterisk denotes strength of level
05:50 GMT - Extending rejection from resistance at the 1.7800/20 congestion and 61.8% Fibonacci level as prices unwind overbought daily studies. Break of the 1.7700 level see room for deeper pullback to the 1.7600 congestion. Below this will return focus to the downside for retest of the 1.7480 low and where break will extend the broader losses from the 1.8160 August/October double top and open up room for extension to the 1.7400 congestion then 1.7250, May low. Meanwhile, resistance at the 1.7800/20 area expected to cap.