Published: 2025-06-02T04:46:54.000Z
Chart USD/IDR Updates: Limited gains

Technical Analyst
2
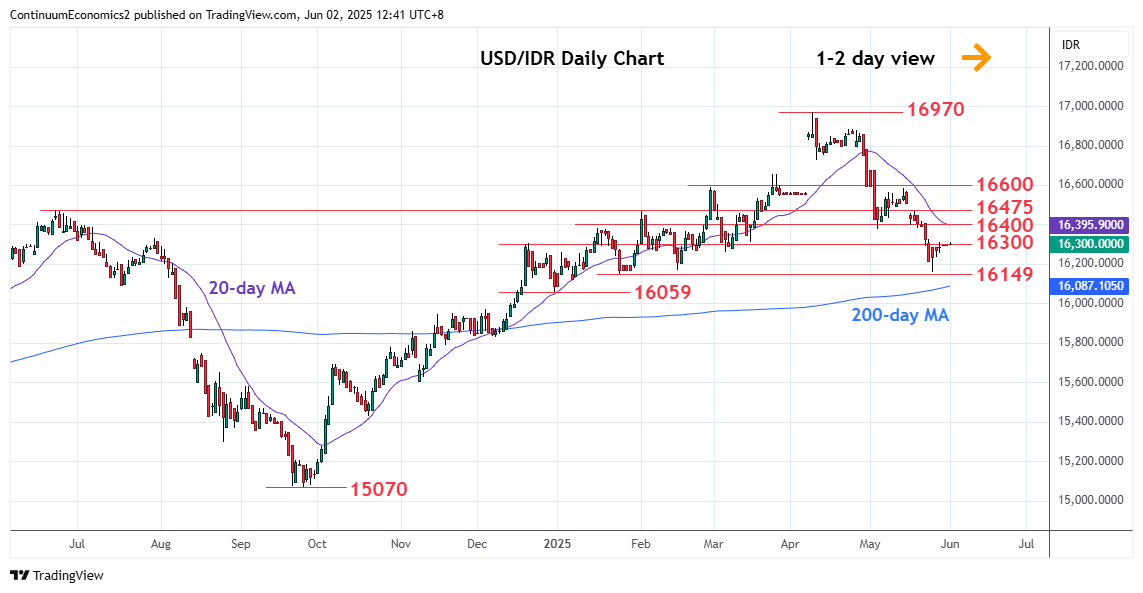
Little change, as prices extending consolidation at the 16300 level following bounce from 16169/16149 support
| Levels | Imp | Comment | Levels | Imp | Comment | |||
|---|---|---|---|---|---|---|---|---|
| R4 | 16584/600 | ** | 14 May high, congestion | S1 | 16149 | * | 24 Jan low | |
| R3 | 16475 | * | Jun 2024 year high | S2 | 16124 | * | 7 Jan YTD low | |
| R2 | 16400 | * | congestion | S3 | 16059 | * | 31 Dec low | |
| R1 | 16300 | * | congestion | S4 | 16019 | * | 50% Sep/Apr rally |
Asterisk denotes strength of level
04:45 GMT - Little change, as prices extending consolidation at the 16300 level following bounce from 16169/16149 support. Prices are unwinding the oversold daily studies but corrective bounce expected to remain limited and giving way to renewed selling pressure later. Below 16149 support will see room for deeper pullback to retrace the September/April rally and see scope to retest 7 January YTD low at 16124. Lower still, will target the 16059 support and 16019, 50% Fibonacci level. Meanwhile, resistance starts at the 16300 congestion, clearance here will open up stronger bounce to 16400/16475 area.