Chart GBP/USD Update: Lower in range - studies under pressure
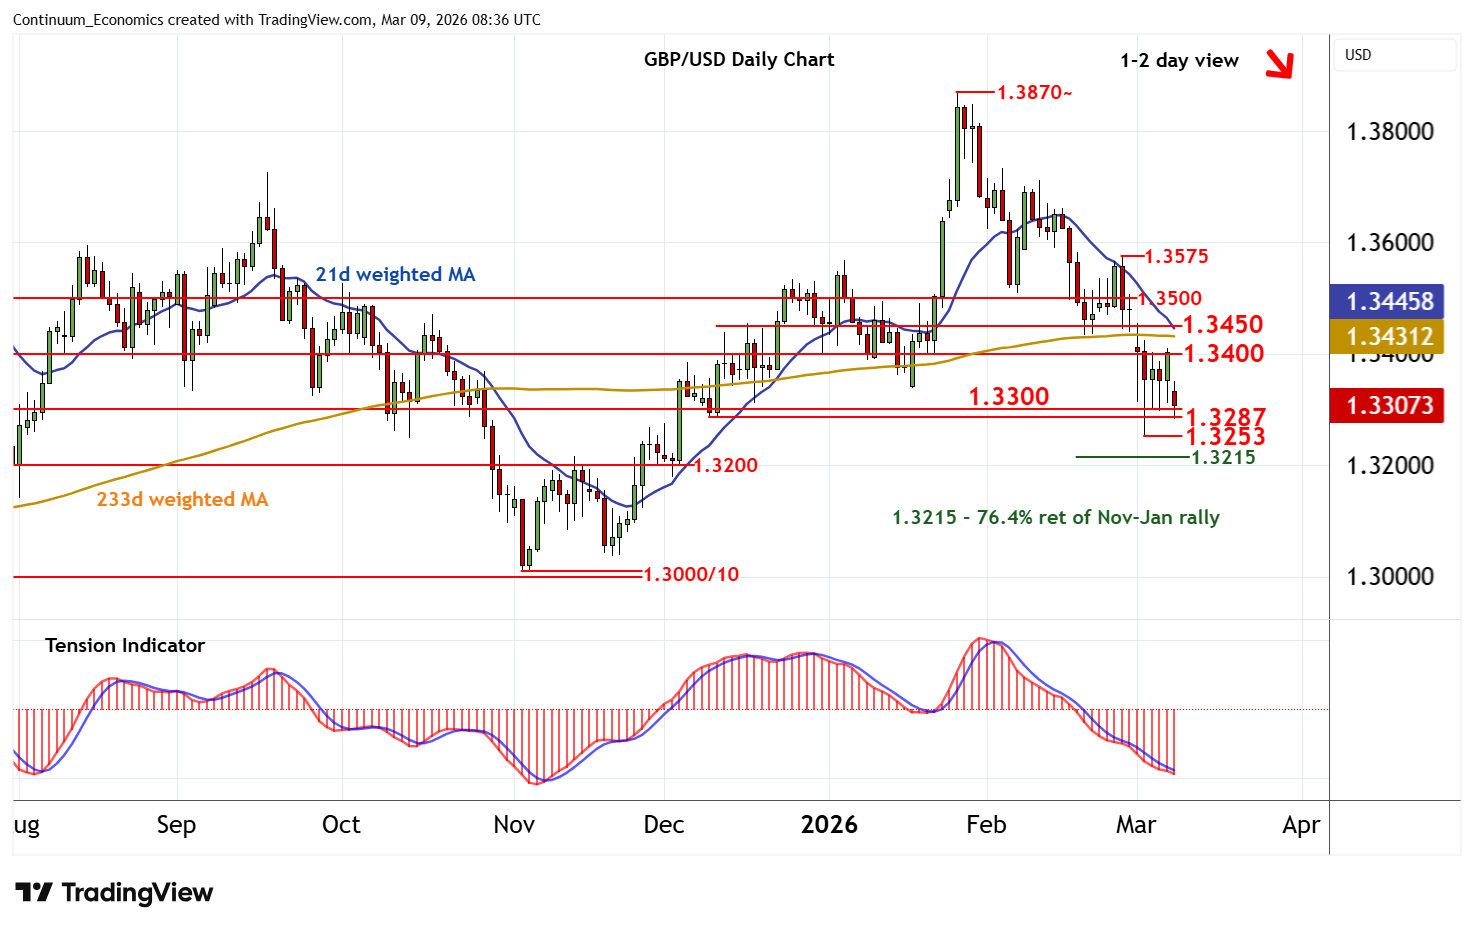
The anticipated test of congestion resistance at 1.3400 has given way to a sharp pullback
| Level | Comment | Level | Comment | |||||
|---|---|---|---|---|---|---|---|---|
| R4 | 1.3600 | * | congestion | S1 | 1.3300 | * | congestion | |
| R3 | 1.3500 | ** | congestion | S2 | 1.3287 | * | 9 Dec (w) low | |
| R2 | 1.3450 | ** | congestion | S3 | 1.3253 | 3 Mar YTD low | ||
| R1 | 1.3400 | ** | congestion | S4 | 1.3200/15 | ** | congestion; 76.4% ret |
Asterisk denotes strength of level
08:10 GMT - The anticipated test of congestion resistance at 1.3400 has given way to a sharp pullback, with prices currently pressuring congestion support at 1.3300. Just beneath here is the 1.3287 weekly low of 9 December. Intraday studies are under pressure and daily readings have also turned down, highlighting room for a break beneath here, with focus then turning to the 1.3253 current year low of 3 March. Negative weekly charts point to room for continuation beneath here, extending late-January losses towards congestion around 1.3200 and the 1.3215 Fibonacci retracement. Meanwhile, resistance remains at 1.3400 and should cap any immediate tests higher.