Chart USD/JPY Update: Choppy trade
The pullback into support at the 150.92 - 151.10 monthly highs from March-August has given way to a bounce
| Levels | Imp | Comment | Levels | Imp | Comment | |||
|---|---|---|---|---|---|---|---|---|
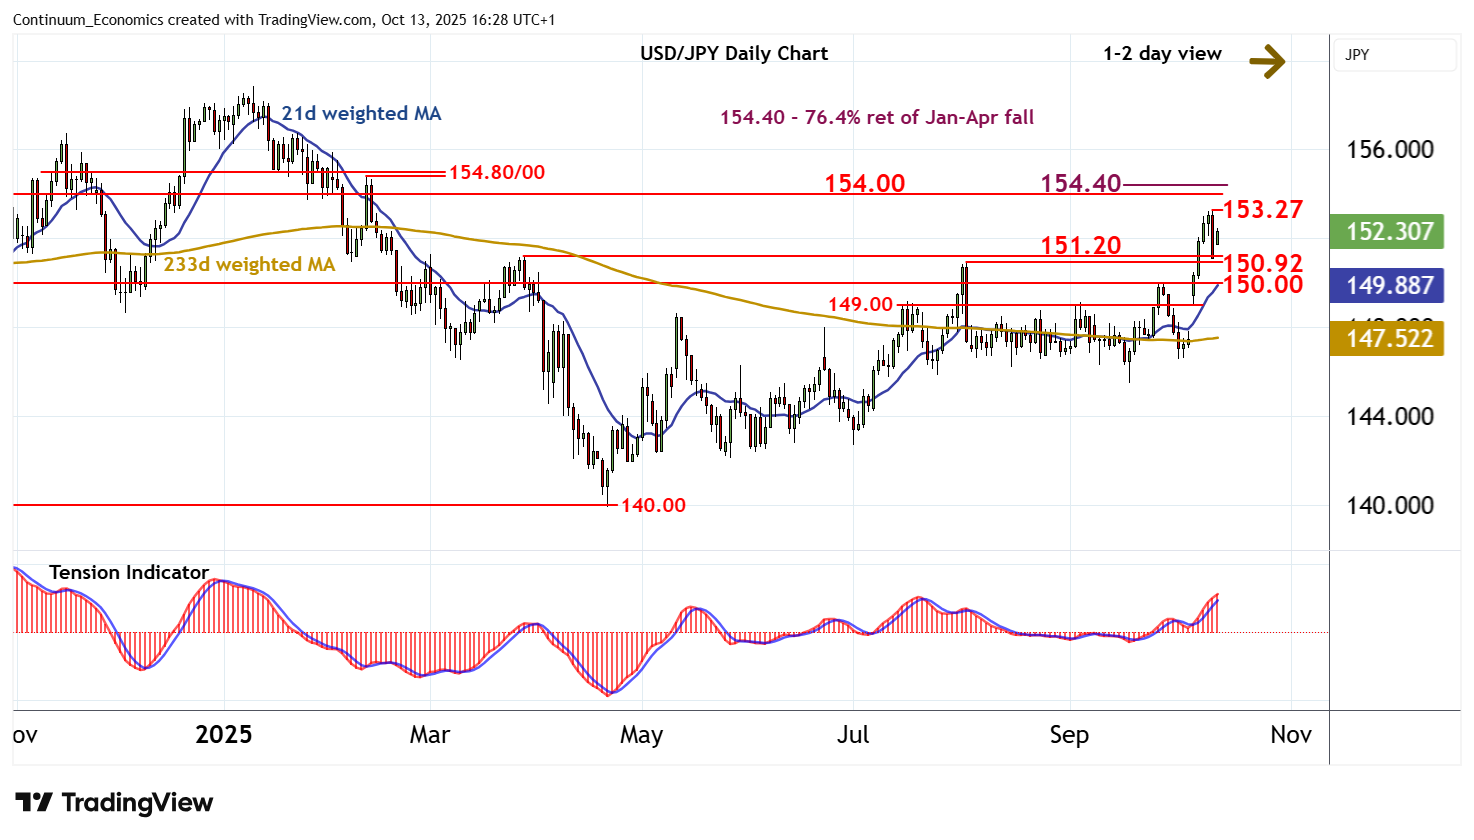
| R4 | 154.80/00 | ** | 12 Feb (w) high; cong | S1 | 150.92/10 | ** | Mar-Aug (m) highs | |
| R3 | 154.40 | ** | 76.4% ret of Jan-Apr fall | S2 | 150.00 | ** | congestion | |
| R2 | 154.00 | ** | congestion | S3 | 149.00 | * | congestion | |
| R1 | 153.25~ | * | 10 Oct YTD high | S4 | 148.00 | * | break level |
Asterisk denotes strength of level
16:00 BST - The pullback into support at the 150.92 - 151.10 monthly highs from March-August has given way to a bounce, with prices currently trading around 152.30. Both daily and weekly charts are mixed, highlighting a cautious tone and potential for further consolidation into the coming sessions. However, longer-term readings are positive, pointing to potential for later gains. A close above the 153.25~ current year high of 10 October will turn sentiment positive and extend April gains towards critical resistance at congestion around 154.00 and the 154.40 Fibonacci retracement. Meanwhile, a close below 150.92/10, if seen, would turn sentiment neutral and prompt consolidation above congestion around 150.00.