Published: 2025-05-02T08:31:31.000Z
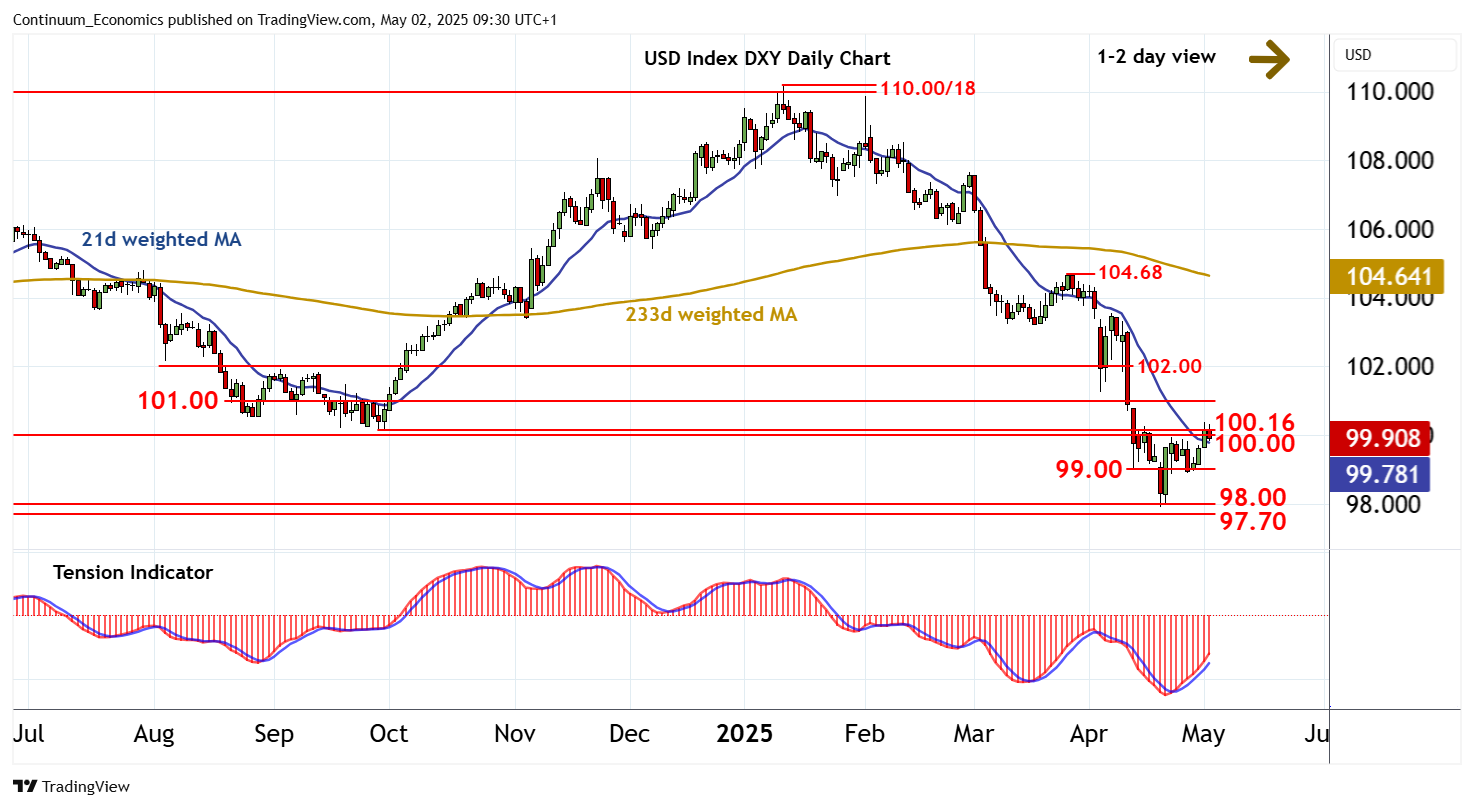
Chart USD Index DXY Update: Meeting selling pressure within 100.00/16

Senior Technical Strategist
-
Little change, as prices extend consolidation
| Levels | Imp | Comment | Levels | Imp | Comment | |||
|---|---|---|---|---|---|---|---|---|
| R4 | 102.00 | ** | break level | S1 | 99.00 | break level | ||
| R3 | 101.00 | * | break level | S2 | 98.00 | * | congestion | |
| R2 | 100.16 | ** | 27 Sep 2024 (y) low | S3 | 97.70 | * | Feb-Mar 2022 break level | |
| R1 | 100.00 | ** | congestion | S4 | 96.50 | * | congestion |
Asterisk denotes strength of level
09:20 BST - Little change, as prices extend consolidation following the retest of strong resistance at 100.00/16. Intraday studies are falling, unwinding negative divergence, highlighting potential for a short-term pullback. But rising daily readings and a tick higher in oversold weekly stochastics are expected to limit scope in renewed buying interest towards support at 99.00. Following any corrective trade, fresh gains are looked for. A later close above 100.00/16 will turn sentiment positive and extend late-April gains towards resistance at 101.00.