Published: 2026-03-24T14:22:08.000Z
Chart USD/JPY Update: Cautious trade
4
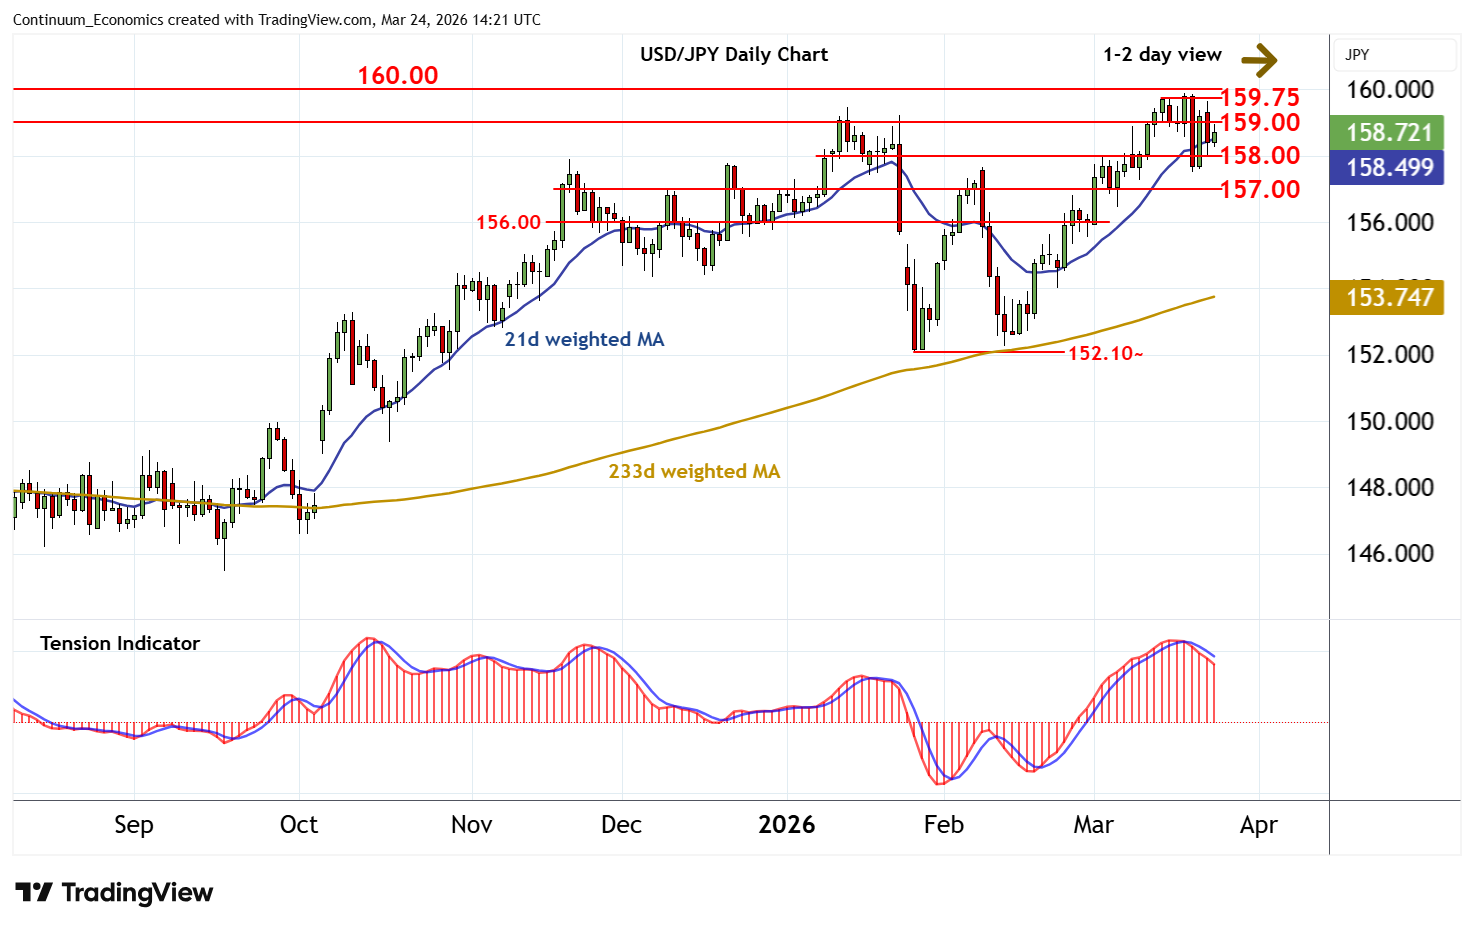
Little change, as prices extend cautious trade within the 158.00 - 159.00 range
| Levels | Imp | Comment | Levels | Imp | Comment | |||
|---|---|---|---|---|---|---|---|---|
| R4 | 160.40 | ** | April 1990 (y) high | S1 | 158.00 | * | break level | |
| R3 | 160.00 | ** | historic congestion | S2 | 157.50 | 19 Mar low | ||
| R2 | 159.75 | ** | 13 Mar YTD high | S3 | 157.00 | congestion | ||
| R1 | 159.00 | * | congestion | S4 | 156.45 | * | 4 Mar low |
Asterisk denotes strength of level
14:10 GMT - Little change, as prices extend cautious trade within the 158.00 - 159.00 range. Daily stochastics and the daily Tension Indicator are falling, highlighting potential for a break below 158.00. But daily stochastics are approaching oversold areas and broader weekly charts are rising, suggesting initial scope should be limited in consolidation above congestion around 157.00. Meanwhile, resistance remains at 159.00. But a close above the 160.40 year high of April 1990 is needed to turn sentiment positive and confirm continuation of long-term bull trends.