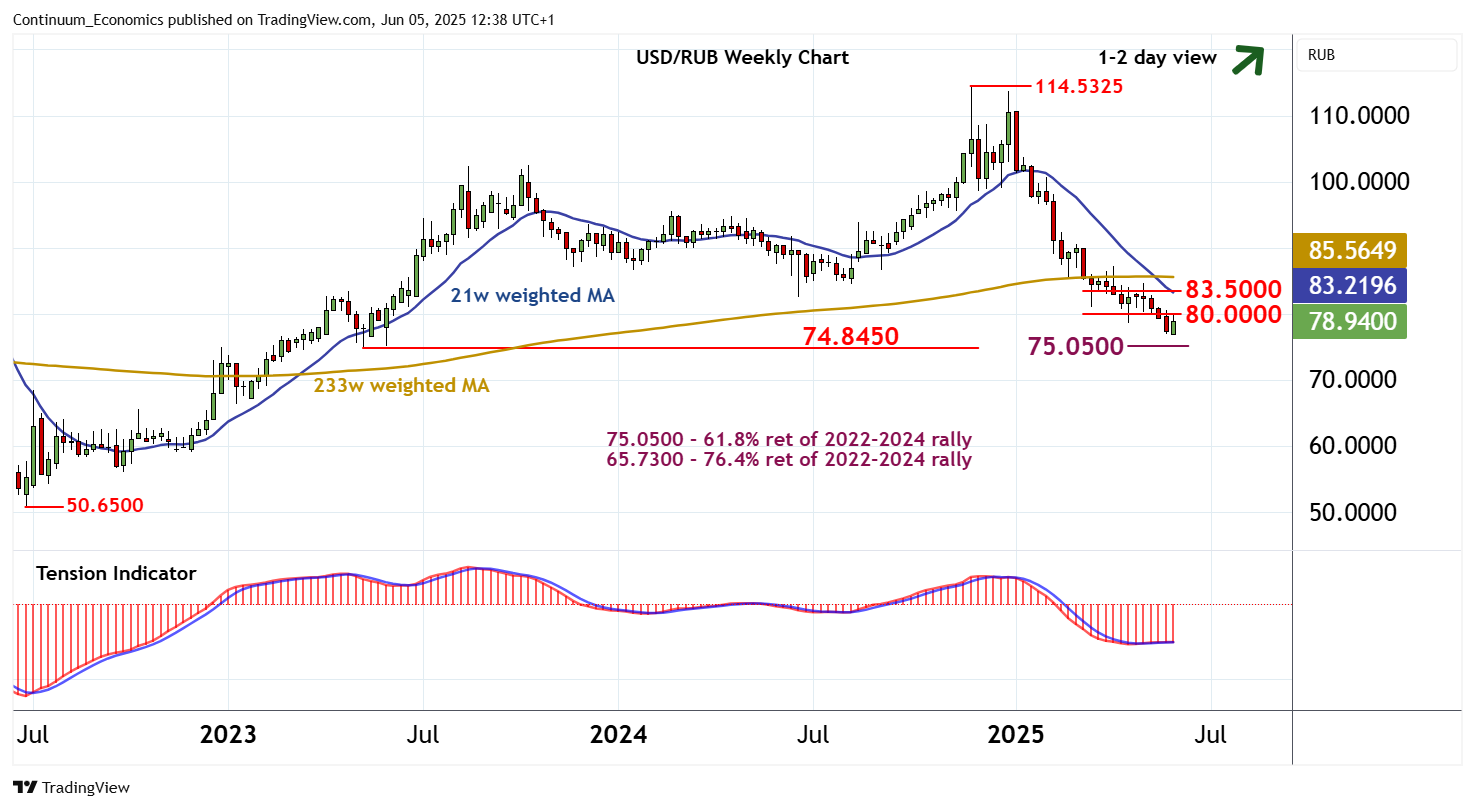
Chart USD/RUB Update: Room for a test above 80.0000

Little change, as prices extend consolidation beneath congestion around 80.0000
| Levels | Comment | Levels | Comment | |||||
| R4 | 85.0000 | ** | congestion | S1 | 76.8600~ | ** | 29 May YTD low | |
| R3 | 83.5000 | * | congestion | S2 | 75.0500 | ** | 61.8% ret of 2022-2024 rally | |
| R2 | 81.0000 | * | break level | S3 | 74.8450 | ** | May 2023 low | |
| R1 | 80.0000 | ** | congestion | S4 | 73.0000 | break level |
Asterisk denotes strength of level
12:30 BST - Little change, as prices extend consolidation beneath congestion around 80.0000, following the bounce from the 2025 year low at 76.8600~. Daily stochastics are flattening in overbought areas, suggesting potential for further consolidation. But a tick higher in both the daily Tension Indicator and oversold weekly stochastics highlight room for a test above here. Focus will turn to 81.0000. But the flat weekly Tension Indicator and mixed/negative longer-term charts are expected to limit any extension beyond here in renewed selling interest towards congestion around 83.5000. Meanwhile, a close below 76.8600, not yet seen, will add weight to sentiment and extend November 2024 losses towards strong support at the 74.8450 low of May 2023 and the 75.0500 Fibonacci retracement.