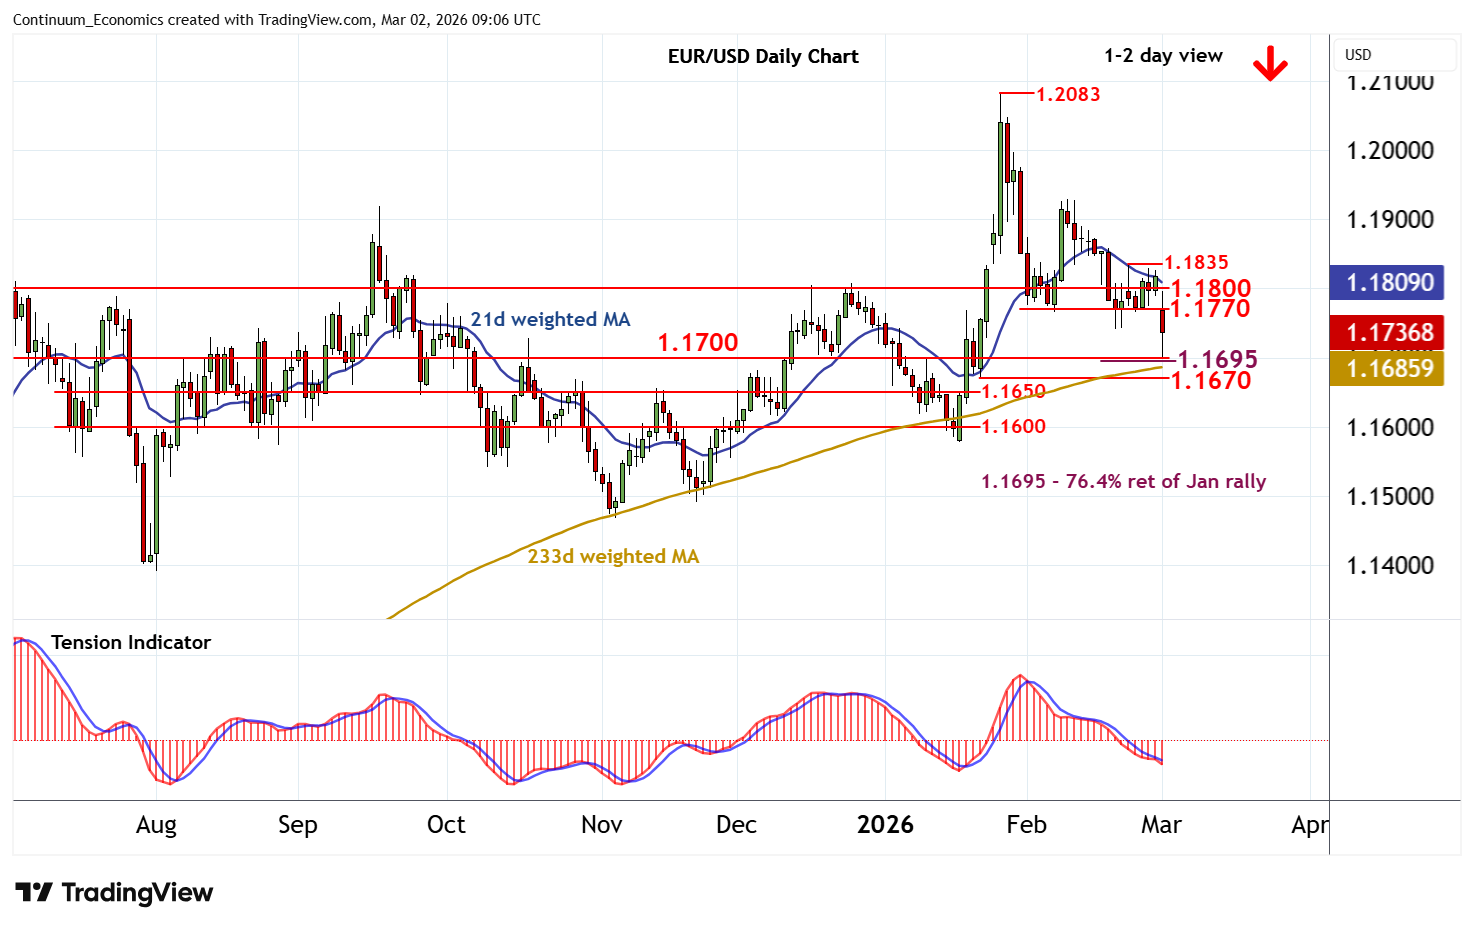
Chart EUR/USD Update: Reached strong support - studies under pressure
Anticipated losses have reached strong support at the 1.1695 Fibonacci retracement and congestion around 1.1700
| Levels | Imp | Comment | Levels | Imp | Comment | |||
|---|---|---|---|---|---|---|---|---|
| R4 | 1.1850 | * | break level | S1 | 1.1695/00 | ** | 76.4% ret; congestion | |
| R3 | 1.1835 | * | 23 Feb (w) high | S2 | 1.1670 | * | 22 Jan low | |
| R2 | 1.1800 | * | congestion | S3 | 1.1650 | * | congestion | |
| R1 | 1.1770 | congestion lows | S4 | 1.1600 | ** | congestion |
*Asterisk denotes strength of level
08:50 GMT - Anticipated losses have reached strong support at the 1.1695 Fibonacci retracement and congestion around 1.1700. A smart bounce is pushing prices back to 1.1730, but negative intraday studies and bearish daily readings should limit any further gains in renewed selling interest towards resistance at congestion lows around 1.1770. A close above here, if seen, will help to stabilise price action and prompt consolidation within the 1.1800 - 1.1835 range. In the coming sessions, further losses are looked for. A break below 1.1695/00 will open up the 1.1670 low of 22 January. However, bearish weekly charts see room for continuation of late-January losses towards 1.1650.