Chart GBP/USD Update: Consolidating - downside tests to remain limited

Little change, as mixed intraday studies keep near-term sentiment cautious
| Level | Comment | Level | Comment | |||||
|---|---|---|---|---|---|---|---|---|
| R4 | 1.2765 | ** | 50% ret of Sep-Jan fall | S1 | 1.2550 | * | break level | |
| R3 | 1.2700 | * | congestion | S2 | 1.2500 | * | break level | |
| R2 | 1.2640 | ** | 76.4% ret of Dec-Jan fall | S3 | 1.2450 | break level | ||
| R1 | 1.2600 | * | congestion | S4 | 1.2400 | * | congestion |
Asterisk denotes strength of level
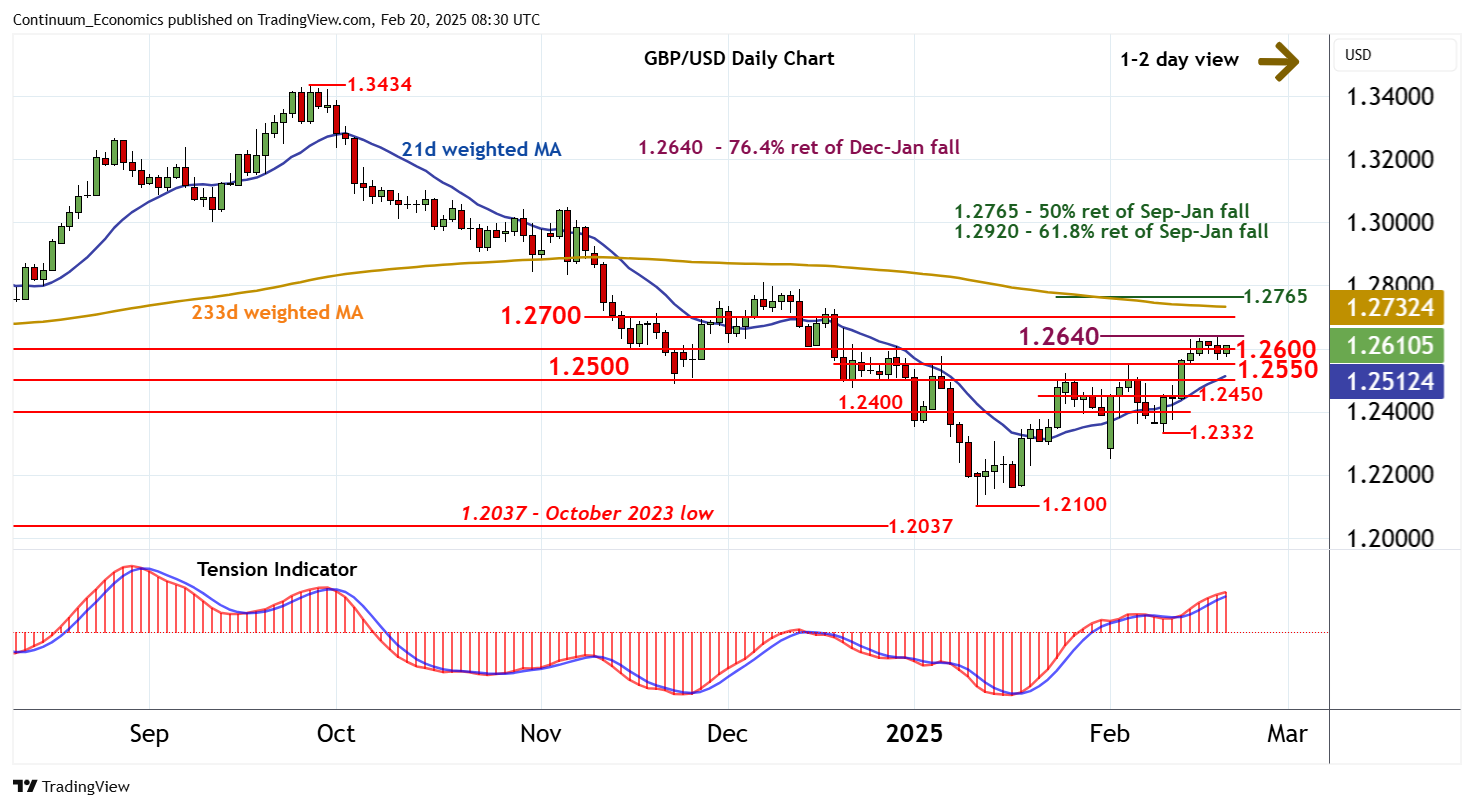
08:10 GMT - Little change, as mixed intraday studies keep near-term sentiment cautious and extend consolidation around resistance at congestion around 1.2600 and the 1.2640 Fibonacci retracement. Overbought daily stochastics are turning down and the positive daily Tension Indicator is flattening, suggesting room for a minor pullback towards support at 1.2550. But positive weekly charts should limit any tests in renewed buying interest/consolidation. A break beneath here, however, will add weight to sentiment and open up 1.2500. Following cautious trade, higher levels are looked for. A close above 1.2640 is needed to turn sentiment positive and extend January gains towards congestion around 1.2700.