Published: 2026-03-16T00:51:14.000Z
Chart NZD/USD Update: Consolidating at .5775 Fibonacci level
1
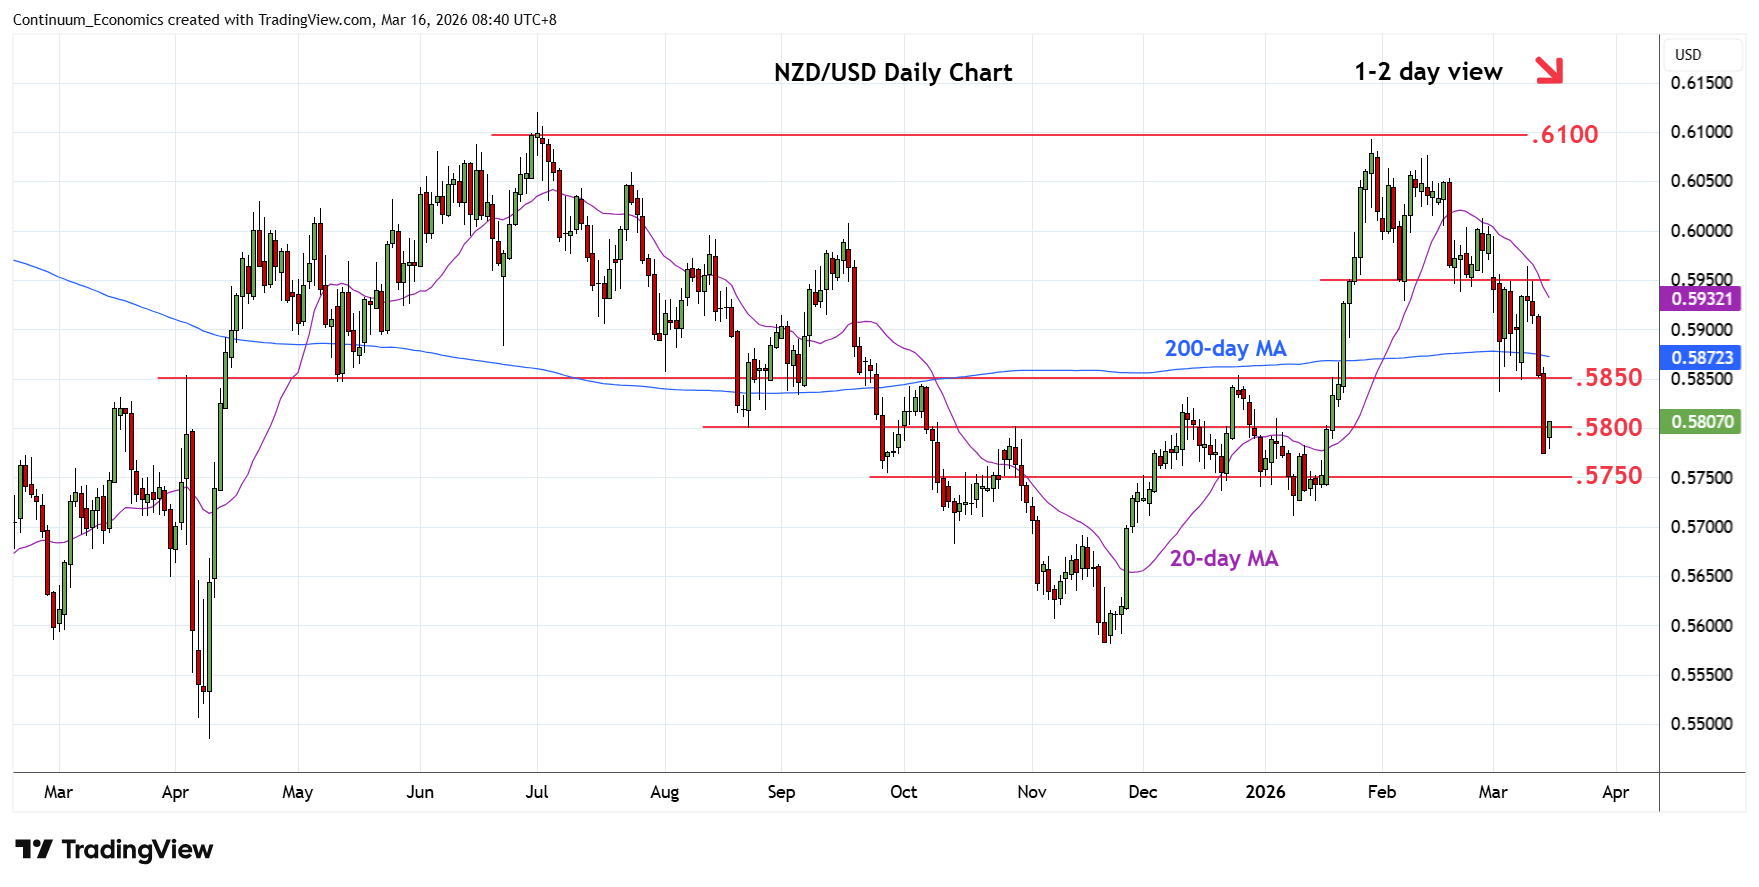
Break of the .5850 support last Friday saw sharp losses through the .5800 level before stabilising at .5775
| Levels | Imp | Comment | Levels | Imp | Comment | |||
|---|---|---|---|---|---|---|---|---|
| R4 | .5930/50 | ** | 6 Feb low, congestion | S1 | .5775 | * | 61.8% Nov/Jan rally | |
| R3 | .5900 | * | congestion | S2 | .5750 | * | congestion | |
| R2 | .5850 | * | congestion | S3 | .5710/00 | ** | Jan low, 76.4% | |
| R1 | .5835 | * | 3 Mar low | S4 | .5650 | congestion |
Asterisk denotes strength of level
00:45 GMT - Break of the .5850 support last Friday saw sharp losses through the .5800 level before stabilising at .5775, 61.8% Fibonacci level. Consolidation here expected to give way to renewed selling pressure later as negative daily and weekly studies weighs. Lower will see room to support at .5750 congestion then then .5710/00 low of January and 76.4% Fibonacci retracement. Meanwhile, resistance is lowered to the .5835/50, 3 March low and congestion area. This is expected expected to cap and sustain losses from the .6093, January current year high.