Published: 2025-10-24T11:43:53.000Z
Chart GBP/USD Update: Reached 1.3300 - studies under pressure
1
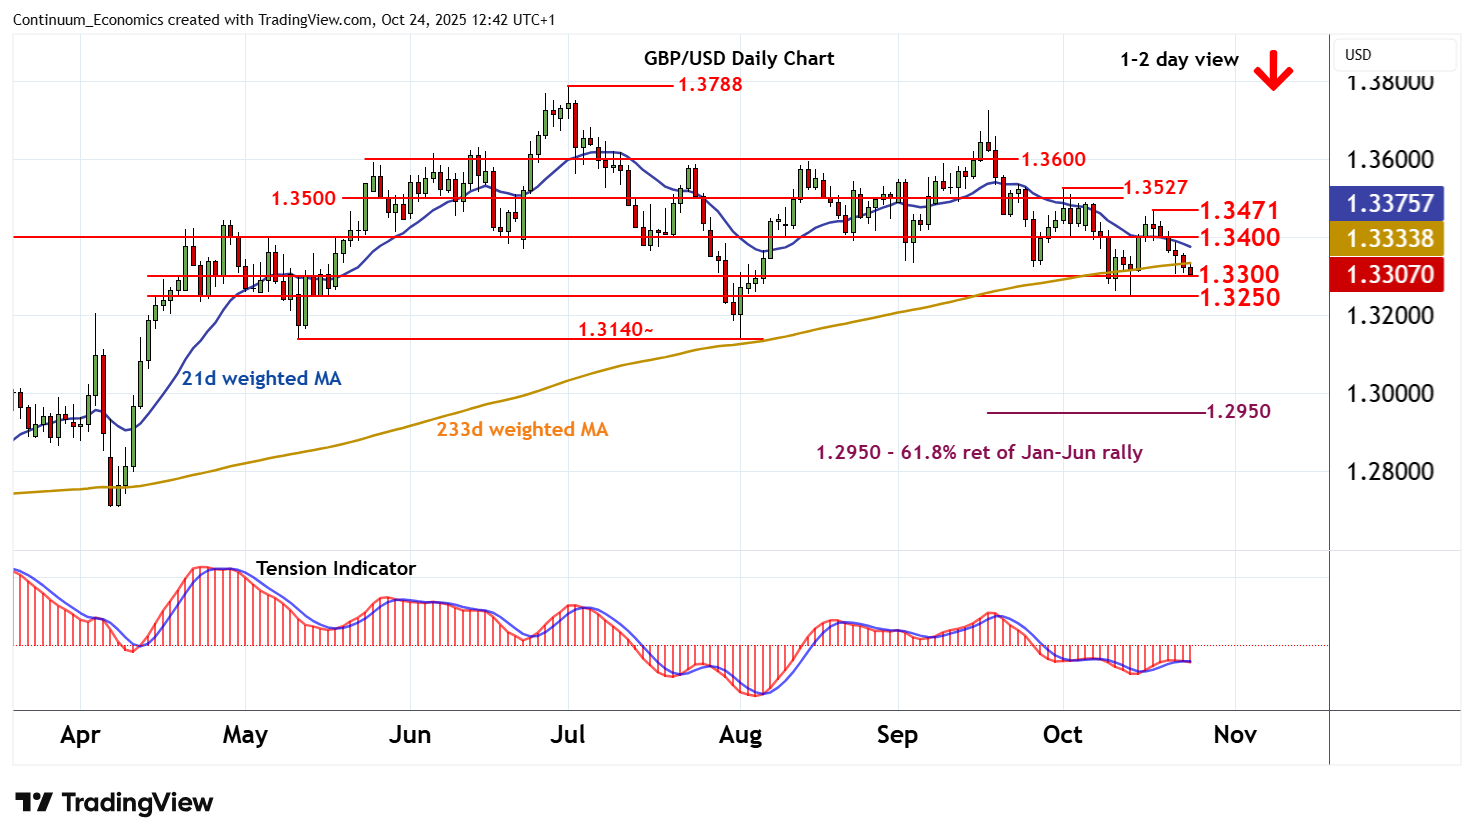
Anticipated losses have reached congestion support at 1.3300
| Level | Comment | Level | Comment | |||||
|---|---|---|---|---|---|---|---|---|
| R4 | 1.3527 | ** | 1 Oct (w) high | S1 | 1.3300 | * | congestion | |
| R3 | 1.3500 | * | congestion | S2 | 1.3250 | * | congestion | |
| R2 | 1.3471 | 17 Oct (w) high | S3 | 1.3200 | * | congestion | ||
| R1 | 1.3400 | * | congestion | S4 | 1.3140~ | ** | May-Aug (m) range lows |
Asterisk denotes strength of level
12:15 BST - Anticipated losses have reached congestion support at 1.3300, where fresh consolidation is developing. Daily readings continue to deteriorate and broader weekly charts are negative, highlighting room for fresh losses in the coming sessions. A break below 1.3300 will open up further congestion around 1.3250. Continuation of mid-September losses towards 1.3200 cannot be ruled out. Meanwhile, resistance remains at congestion around 1.3400. A close above here, if seen, would help to stabilise price action and give way to consolidation beneath the 1.3471 weekly high of 17 October.