Chart USD Index DXY Update: Cautious trade - background studies improving

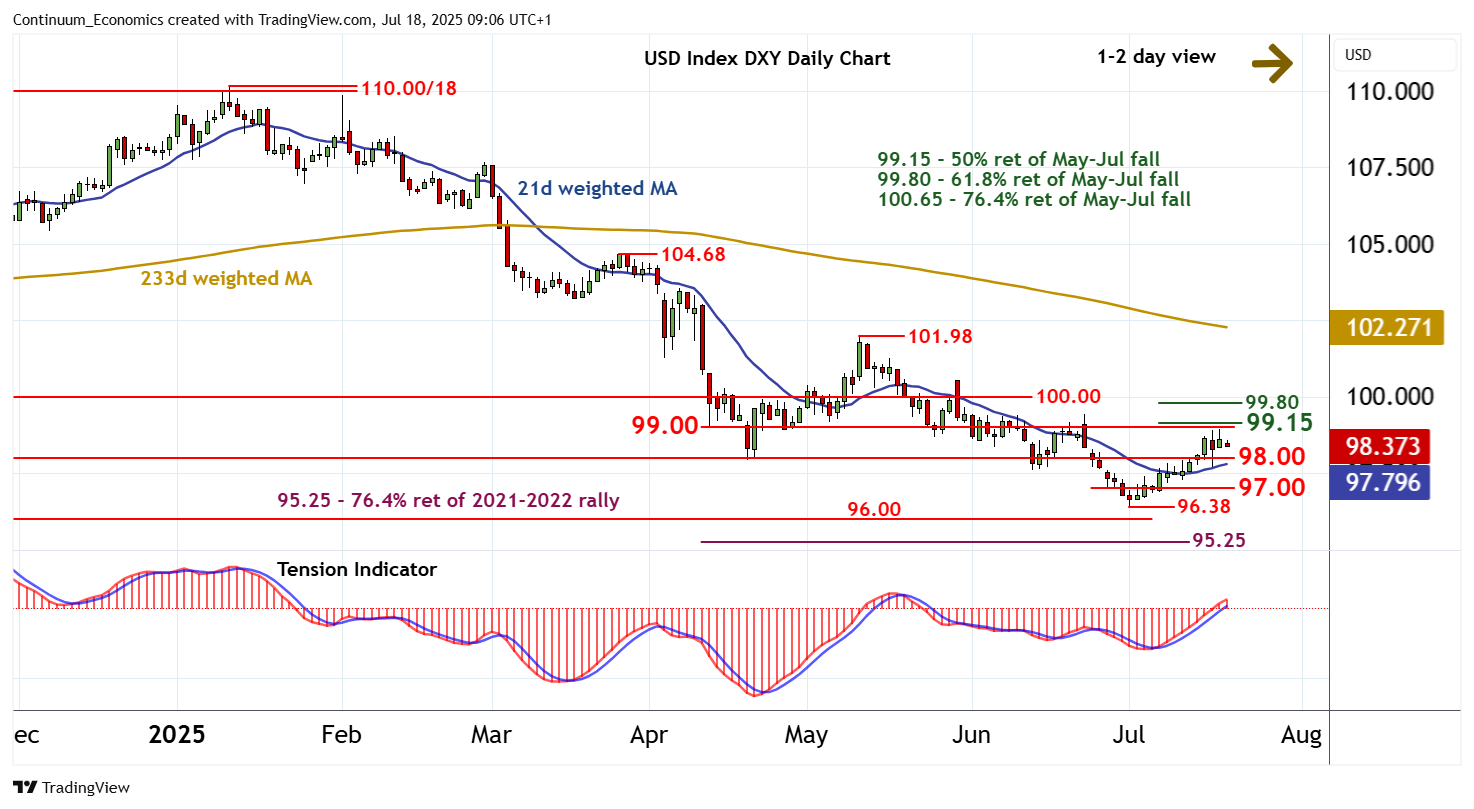
Cautious trade beneath resistance at 99.00 and the 99.15 Fibonacci retracement has given way to a minor pullback
| Levels | Imp | Comment | Levels | Imp | Comment | |||
|---|---|---|---|---|---|---|---|---|
| R4 | 99.80 | ** | 61.8% ret of May-Jul fall | S1 | 98.00 | * | congestion | |
| R3 | 99.15 | ** | 50% ret of May-Jul fall | S2 | 97.00 | * | congestion | |
| R2 | 99.00 | break level | S3 | 96.50 | * | congestion | ||
| R1 | 98.95 | 17 Jul high | S4 | 96.38 | * | 1 Jul YTD low |
Asterisk denotes strength of level
09:00 BST - Cautious trade beneath resistance at 99.00 and the 99.15 Fibonacci retracement has given way to a minor pullback, as intraday studies turn down, with prices currently balanced around 98.40. Overbought daily stochastics are also unwinding, highlighting room for a move down to congestion support at 98.00. But the positive daily Tension Indicator and improving weekly charts should limit any tests in renewed buying interest. Following cautious trade, fresh gains are looked for. A later close above the 99.15 Fibonacci retracement will improve sentiment and extend July gains towards the 99.80 retracement and congestion around 100.00. Meanwhile, a close below 98.00, if seen, will turn sentiment neutral and give way to consolidation above further congestion around 97.00.