Published: 2026-02-05T01:23:59.000Z
Chart GBP/USD Update: Extend consolidation above 1.3623 low
2
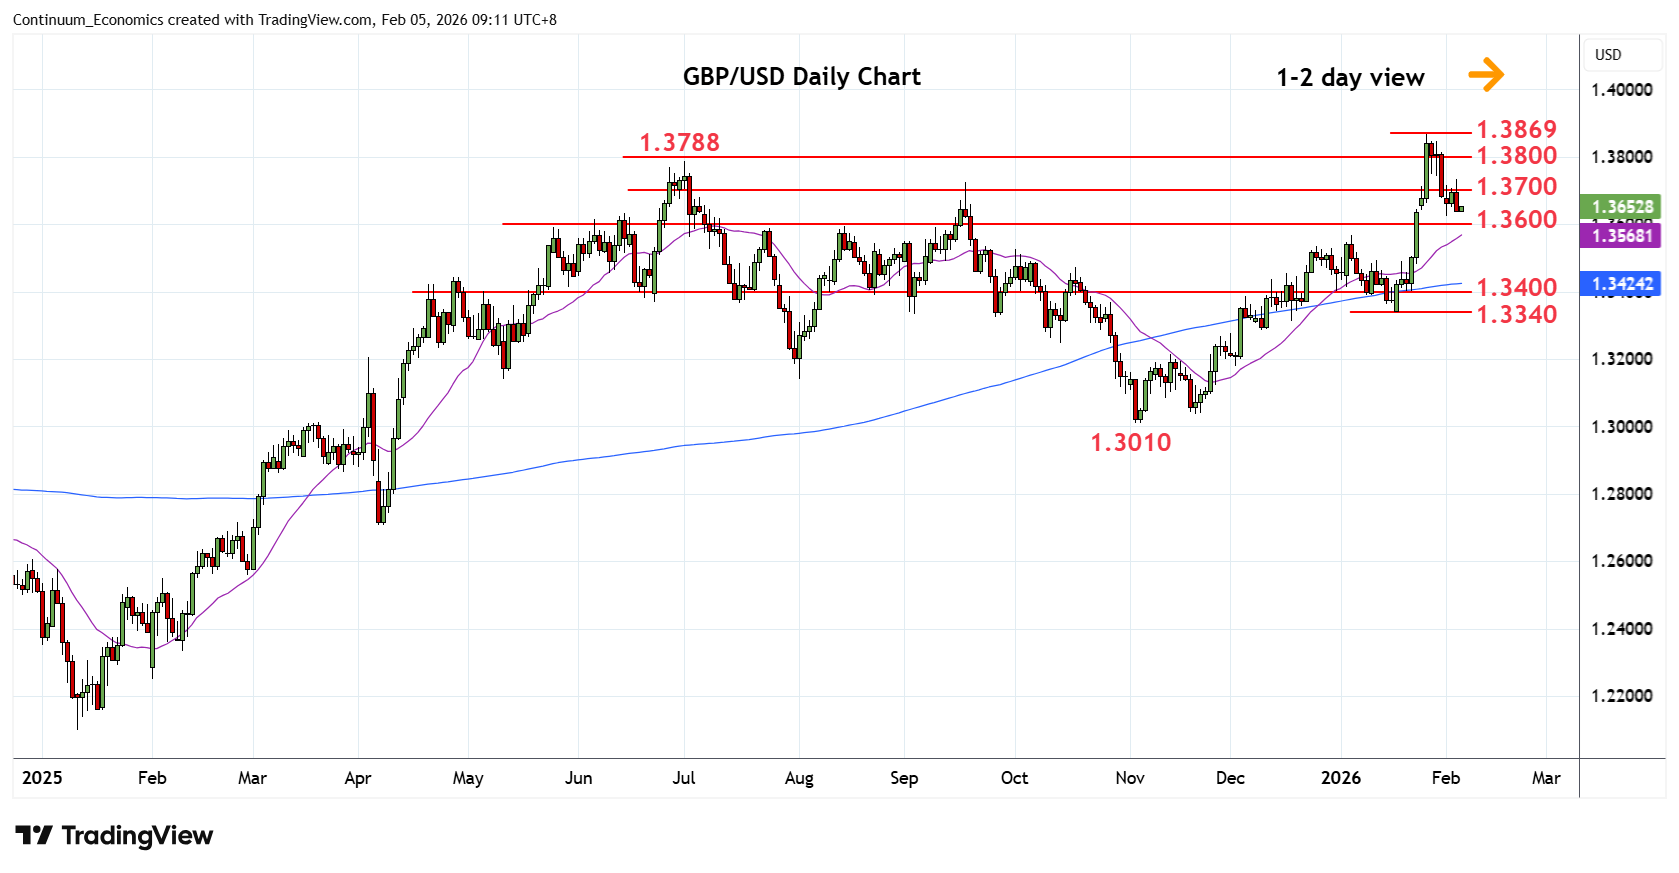
Failure to sustain break above the 1.3700 level see prices settling back to consolidate pullback from the 1.3869 high
| Level | Comment | Level | Comment | |||||
|---|---|---|---|---|---|---|---|---|
| R4 | 1.3900/10 | * | congestion, Sep 2021 high | S1 | 1.3623 | * | 2 Feb low | |
| R3 | 1.3869 | ** | 27 Jan YTD high | S2 | 1.3600 | * | congestion | |
| R2 | 1.3788/00 | * | Jul high, congestion | S3 | 1.3568 | ** | 6 Jan high | |
| R1 | 1.3700/50 | * | congestion | S4 | 1.3500 | * | congestion |
Asterisk denotes strength of level
01:20 GMT - Failure to sustain break above the 1.3700 level see prices settling back to consolidate pullback from the 1.3869 high. Daily studies are tracking lower and threatens break of the 1..3623 low to open up room for deeper pullback to strong support at the 1.3600/1.3568, congestion and 6 January high. However, corrective pullback is expected to give way to renewed buying interest later with resistance starting at the 1.3700/50 area. Clearance here will return focus to the upside for retest of the 1.3800 level then the 1.3869 January high.