Published: 2026-04-07T00:25:29.000Z
Chart AUD/USD Update: Extend consolidation above .6860/33 lows
1
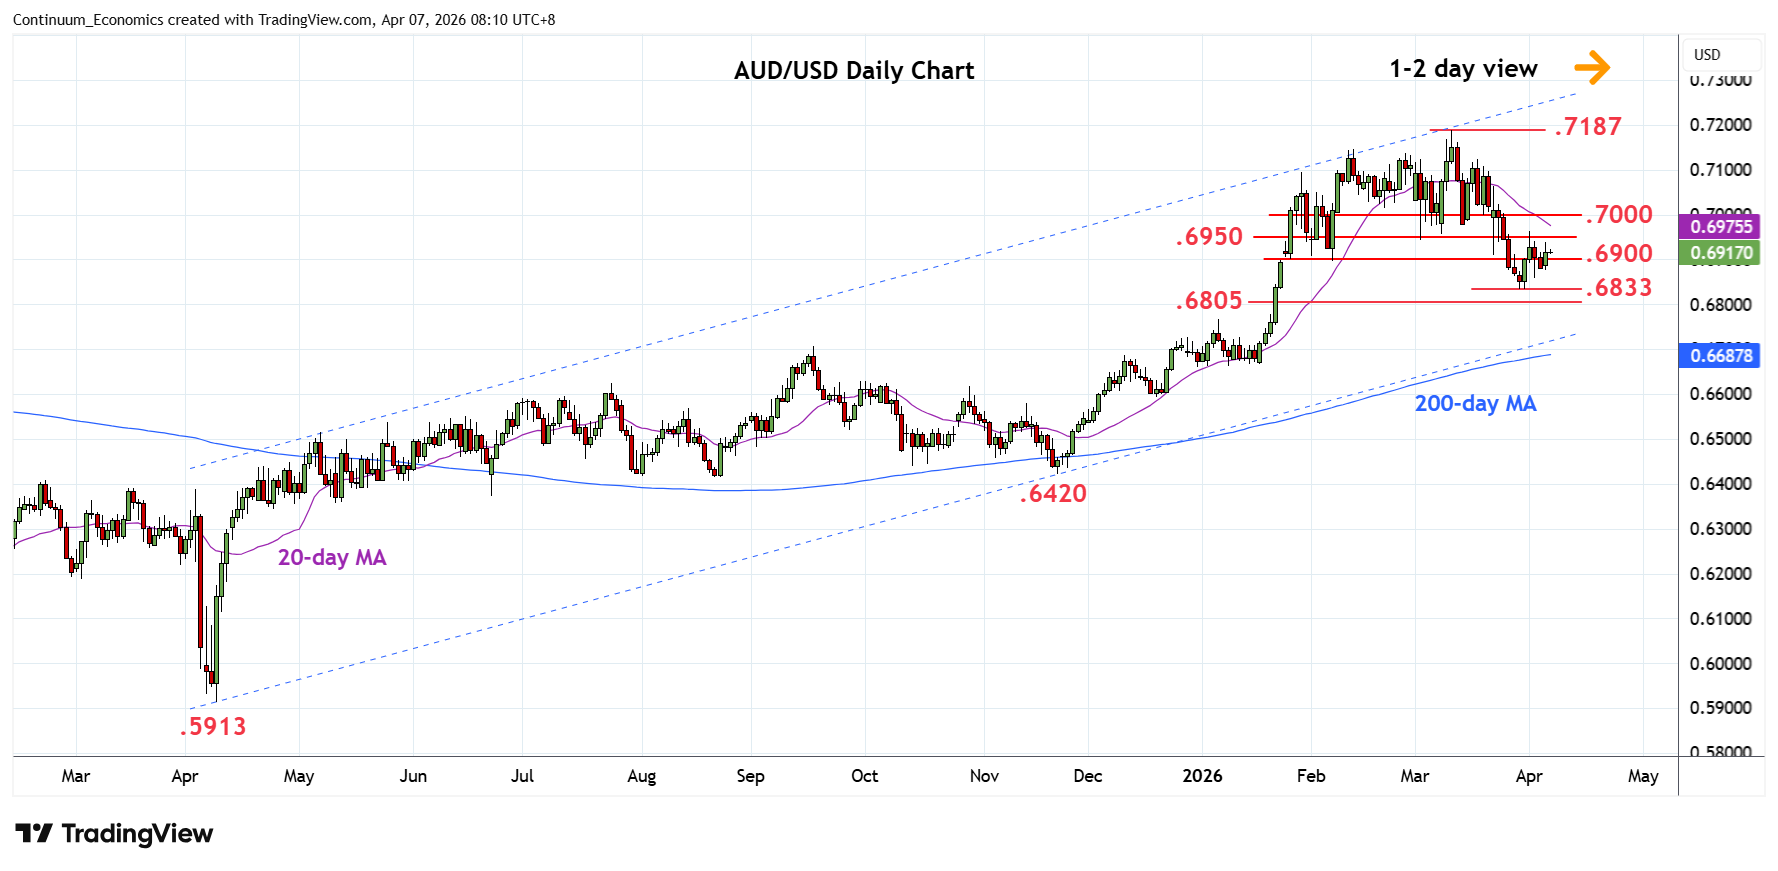
Edged higher in consolidation to extend bounce from the .6860/33 lows of last week
| Levels | Imp | Comment | Levels | Imp | Comment | |||
|---|---|---|---|---|---|---|---|---|
| R4 | 0.7100 | * | congestion | S1 | 0.6860 | * | 2 Apr low | |
| R3 | 0.7050 | * | congestion | S2 | 0.6833 | ** | 30 Mar low | |
| R2 | 0.7000 | ** | congestion | S3 | 0.6805 | * | 50% Nov/Mar rally | |
| R1 | 0.6950/62 | * | congestion, 1 Apr high | S4 | 0.6765 | * | 7 Jan high |
Asterisk denotes strength of level
00:20 GMT - Edged higher in consolidation to extend bounce from the .6860/33 lows of last week and regaining the .6900 level sets up scope for retest of .6950/62 congestion and 1 April high. Break here and the .7000 figure will fade the downside pressure and open up room for stronger gains to the .7050/.7100 area. Meanwhile, support at the .6860/33 lows underpin. Would take break here to extend losses from the .7187 March current year high and see deeper pullback to retrace gains from the November low to .6805, 50% Fibonacci retracement.