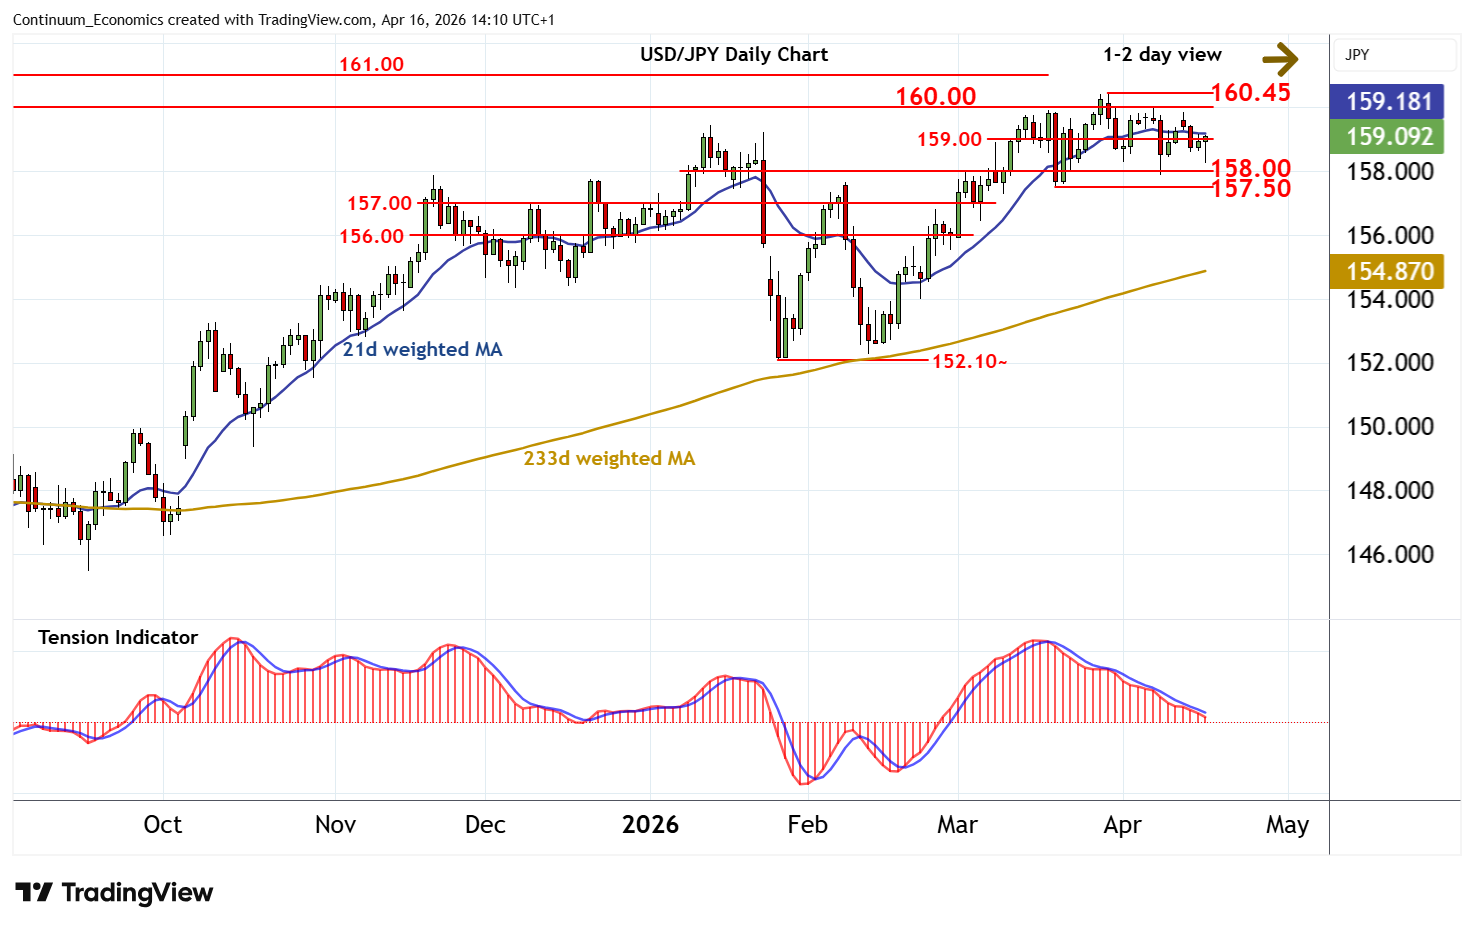
Chart USD/JPY Update: Range extension - background studies under pressure
Anticipated losses have bounced from 158.25, as intraday studies turn higher, with prices currently trading around 159.00
| Levels | Imp | Comment | Levels | Imp | Comment | |||
|---|---|---|---|---|---|---|---|---|
| R4 | 161.00 | * | July 2024 congestion | S1 | 158.00 | ** | congestion | |
| R3 | 160.45 | ** | 30 Mar YTD high | S2 | 157.35/50 | ** | 38.2% ret; 19 Mar (w) low | |
| R2 | 160.00 | ** | historic congestion | S3 | 157.00 | * | congestion | |
| R1 | 159.00 | * | congestion | S4 | 156.35 | ** | 50% ret of Feb-Mar rally |
Asterisk denotes strength of level
13:50 BST - Anticipated losses have bounced from 158.25, as intraday studies turn higher, with prices currently trading around 159.00. A break above here is possible. But negative daily readings and mixed/negative weekly charts should limit scope in renewed selling interest beneath congestion around 160.00. Meanwhile, support remains at congestion around 158.00. Following cautious trade, a break beneath here is looked for. Focus will then turn to the 157.50 weekly low of 19 March, with continuation beneath here turning sentiment negative and extending late-March losses below the 157.35 Fibonacci retracement towards congestion around 157.00.