Published: 2025-02-20T01:57:40.000Z
Chart GBP/USD Update: Extending consolidation

Technical Analyst
1
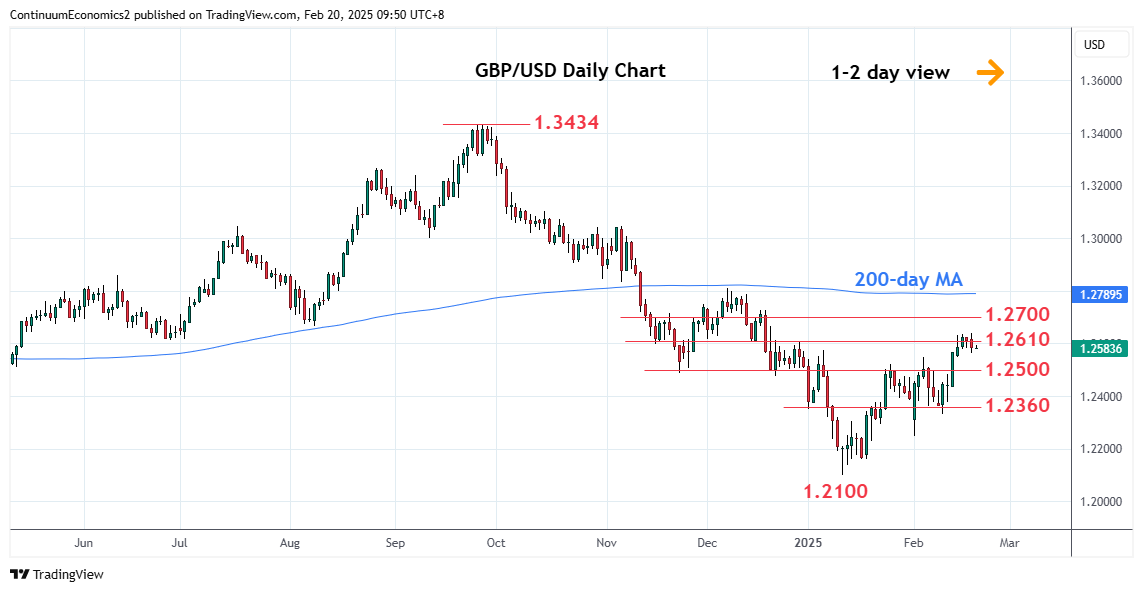
Limited on break above the 1.2600/10 congestion and Fibonacci level as prices extend consolidation from the 1.2640 high to unwind overbought intraday studies
| Level | Comment | Level | Comment | |||||
|---|---|---|---|---|---|---|---|---|
| R4 | 1.2728 | * | 17 Dec high | S1 | 1.2550 | * | 5 Feb high | |
| R3 | 1.2700 | * | congestion | S2 | 1.2500 | * | congestion | |
| R2 | 1.2665 | * | 19 Dec high | S3 | 1.2400 | * | congestion | |
| R1 | 1.2640 | * | 19 Feb YTD high | S4 | 1.2360/32 | ** | congestion, 11 Feb low |
Asterisk denotes strength of level
02:00 GMT - Limited on break above the 1.2600/10 congestion and Fibonacci level as prices extend consolidation from the 1.2640 high to unwind overbought intraday studies. However, bullish structure from the 1.2100 low suggest scope for further gains later to retrace losses from the September high. Higher will see room for extension to the 1.2665/1.2700 area then 1.2765, 50% Fibonacci level. Meanwhile, support remains at the 1.2550 recent high and this extend to the 1.2500 congestion which should underpin and sustain gains from the 1.2100 low.