Published: 2025-11-05T08:28:56.000Z
Chart GBP/USD Update: Short-term reactions above 1.3000
3
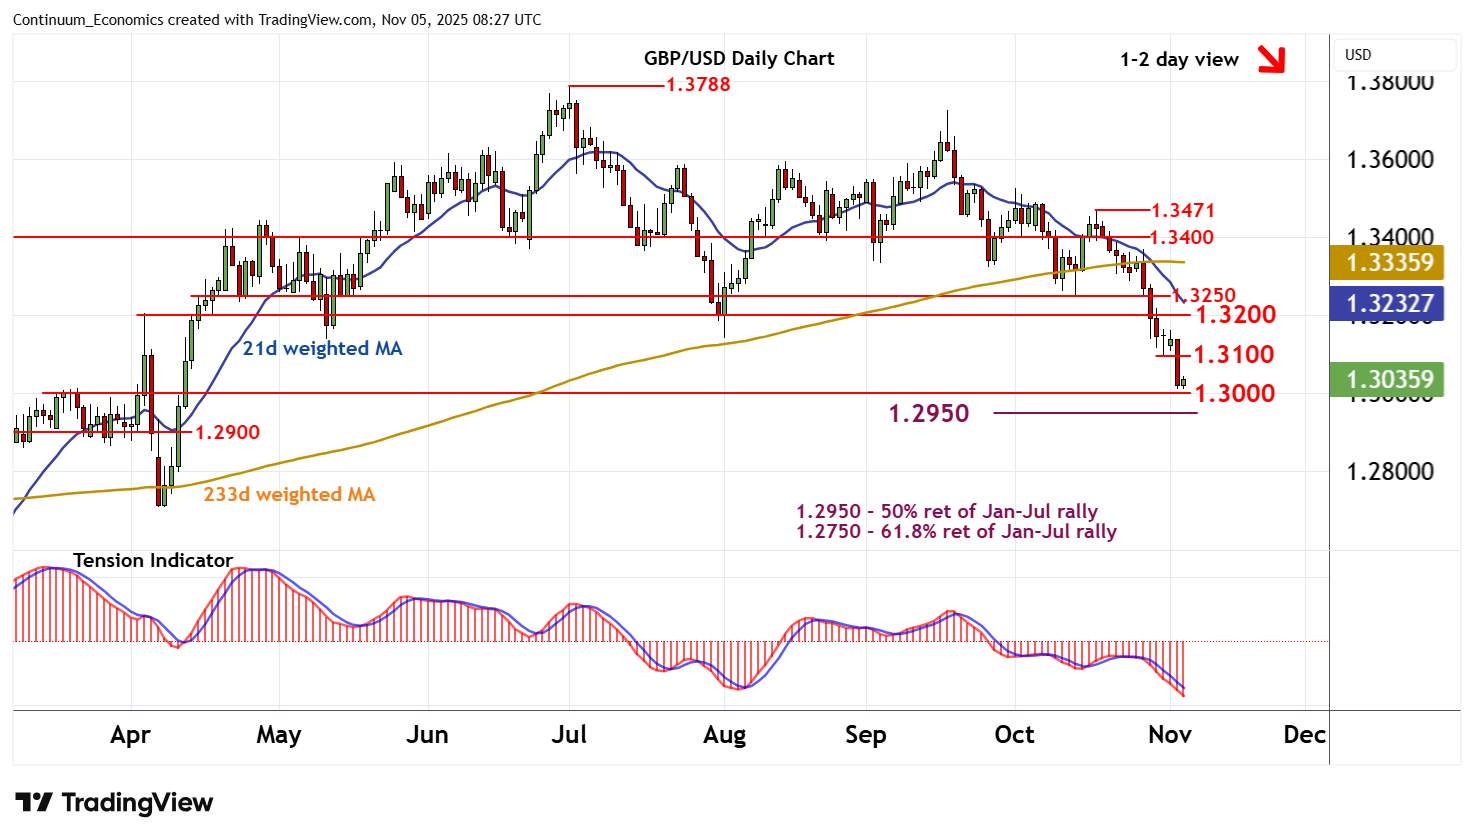
Anticipated losses have met buying interest just above congestion support at 1.3000
| Level | Comment | Level | Comment | |||||
|---|---|---|---|---|---|---|---|---|
| R4 | 1.3400 | ** | break level | S1 | 1.3000 | * | congestion | |
| R3 | 1.3250 | * | congestion | S2 | 1.2950 | ** | 50% ret of Jan-Jul rally | |
| R2 | 1.3200 | * | congestion | S3 | 1.2900 | congestion | ||
| R1 | 1.3100 | * | break level | S4 | 1.2800 | minor congestion |
Asterisk denotes strength of level
08:10 GMT - Anticipated losses have met buying interest just above congestion support at 1.3000, as intraday studies turn higher and oversold daily stochastics flatten, with prices currently trading around 1.3035. A minor bounce is possible, but the bearish daily Tension Indicator and negative weekly charts should limit scope in renewed selling interest beneath resistance at the 1.3100 break level. Following cautious trade, fresh losses are looked for. A break below 1.3000 will open up strong support at the 1.2950 Fibonacci retracement, where oversold daily stochastics could prompt fresh consolidation.